KAZALCI OKOLJA

Environmental indicators in Slovenia


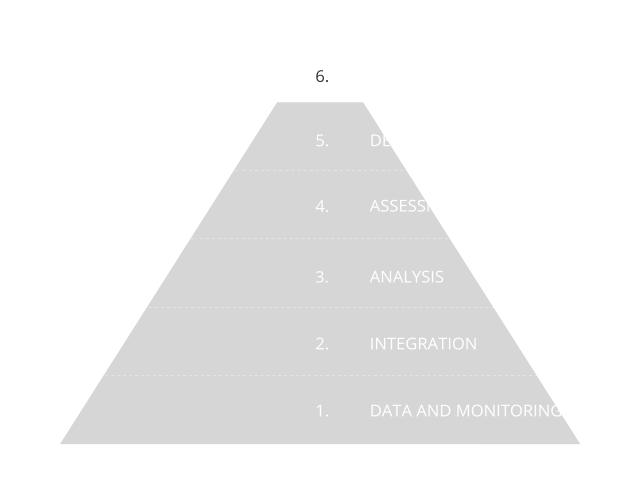
Environmental indicators are based on graphs, maps and assessments and as such present environmental trends in Slovenia. The indicators represent one of the four pillars of our environmental reporting, and are prepared in accordance with the Environmental Protection Act. The Environmental Indicators in Slovenia website enables users to browse among 180 indicators. They are based on numerical data and they indicate the state, characteristics and trends of environmental development in Slovenia. They are prepared using a systematic approach based on data and monitoring, as shown in the information pyramid.

Did you know?

Neutral

Higher levels of heavy metals and nitrogen are observed around the urbanized areas, industrial regions and around thermal power plants. The reason for elevated levels at the western part of Slovenia is transboundary transport of air pollutants from the Po Valley in Italy, however at the eastern part might be transit traffic and agricultural activity. A decrease of heavy metals and nitrogen in mosses is observed in Slovenia since 1995.

Bad

With the increasing share of electric passenger vehicles, CO2 emissions decreased in 2022 and 2023, but increased slightly in 2024 compared to the previous year due to the decrease in the share. The gap to the target value is almost 34%.

The average emissions of all passenger vehicles increased in 2022 compared to the previous year. In 2023, the average emissions decreased back to approximately the level of 2021. The target values were not achieved.

Neutral

In 2023, 65% of the population was connected to municipal wastewater treatment systems with secondary or tertiary treatment, which do not produce GHG emissions. Compared to the previous year, the share increased slightly, and compared to 2017, it rose by 3.5 percentage points.

Good

In 2023, energy efficient district heating (DH) systems, i.e. systems that meet one of the criteria defined in Article 50 of the Act on Energy Efficiency, produced 87,7% of all heat in DO systems, which is the highest value in the observed period. The total share of heat from renewable energy sources (RES) and waste heat amounted to 21,2% in 2023. It increased by 0.5 percentage points compared to the previous year, and by 5.5 percentage points compared to 2016.

Bad

The share of renewable sources in total energy consumption was 18.4% in 2024. It remained unchanged compared to the previous year. The growth of RES is very slow and insufficient to achieve the targets in this area.

Neutral

Total greenhouse gas emissions are projected to remain at similar levels as today until 2030 under projection with existing measures, then decline. Under projection with additional measures emissions will decline faster. By 35% by 2030 and by 88% by 2050. Projections show that with intensive implementation of measures, it is possible to achieve the set targets.