[EN29] Energy efficiency and energy consumption in the industry sector 
[EN29] Energy efficiency and energy consumption in the industry sector

Key message

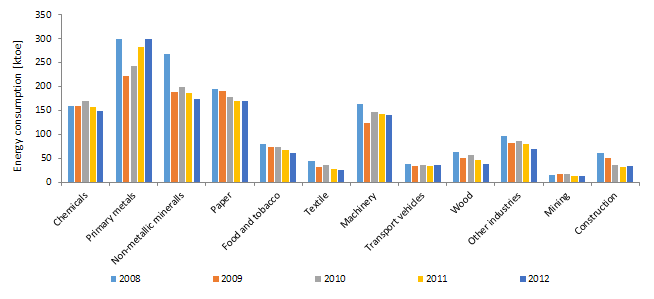
Most of industrial energy is consumed in the production of metals. In the period 2008-2012, the efficiency of energy use has increased, while the trends in individual sectors are very different and diverse.
Definition
Charts
Figure EN29-1: Energy consumption by branches between 2008-2012
Sources:
statistical Office of the RS, EUROSTAT, IJS-CEU, 2013
| 2008 | 2009 | 2010 | 2011 | 2012 | ||
|---|---|---|---|---|---|---|
| Chemicals | [ktoe] | 160 | 158.8 | 168.9 | 156.5 | 148.8 |
| Primary metals | [ktoe] | 299.1 | 221.2 | 241.8 | 281.6 | 299.2 |
| Non-metallic mineralls | [ktoe] | 268.5 | 188.7 | 198 | 186.8 | 173.3 |
| Paper | [ktoe] | 193.8 | 191 | 178.8 | 170.4 | 169.3 |
| Food and tobacco | [ktoe] | 79.9 | 73.7 | 72.5 | 67.9 | 61.6 |
| Textile | [ktoe] | 44.7 | 30.9 | 34.7 | 28.4 | 25 |
| Machinery | [ktoe] | 163 | 123.9 | 147.5 | 141.5 | 140.2 |
| Transport vehicles | [ktoe] | 37.9 | 34.5 | 36.8 | 34.4 | 34.9 |
| Wood | [ktoe] | 63.7 | 50.8 | 56 | 45.5 | 38 |
| Other industries | [ktoe] | 96.2 | 81.9 | 85.5 | 78.7 | 70 |
| Mining | [ktoe] | 15.4 | 16.2 | 16 | 13.3 | 13.6 |
| Construction | [ktoe] | 61.1 | 50.3 | 36.5 | 30.8 | 34.2 |
| Total industry | [ktoe] | 1483.3 | 1222 | 1272.9 | 1235.7 | 1208 |
Figure EN29-2: Energy efficiency progress in industry as a whole and branches with the largest share in enegy consumption
Sources:
IJS-CEU, 2013
| 2008 | 2009 | 2010 | 2012 | 2012 | ||
|---|---|---|---|---|---|---|
| Chemicals | 2008=100 | 100 | 109.4 | 108.6 | 95.8 | 88.7 |
| Steel | 2008=100 | 100 | 120.7 | 108.4 | 98.2 | 105.2 |
| Non ferrous metals | 2008=100 | 100 | 98.5 | 79.1 | 104.1 | 113.9 |
| Non-metallic mineralls | 2008=100 | 100 | 97.1 | 103.2 | 107.6 | 104.7 |
| Paper | 2008=100 | 100 | 99.3 | 91 | 90.7 | 89.6 |
| Machinery | 2008=100 | 100 | 98.5 | 107.1 | 95.5 | 93.7 |
| Total industry | 2008=100 | 100 | 103 | 100.2 | 96.7 | 95.9 |
| Food and tobacco | 2008=100 | 100 | 98 | 96.8 | 86.4 | 82.9 |
| Textile | 2008=100 | 100 | 124.9 | 135.6 | 107.7 | 104.5 |
| Transport vehicles | 2008=100 | 100 | 100.4 | 95.7 | 95 | 109.3 |
| Wood | 2008=100 | 100 | 105.6 | 110.6 | 94.8 | 85 |
| Other industries | 2008=100 | 100 | 103 | 100.4 | 91.2 | 82.1 |
| Mining | 2008=100 | 100 | 112.7 | 83.7 | 84.9 | 87.3 |
| Construction | 2008=100 | 100 | 95.2 | 84.1 | 79.1 | 94.4 |
Figure EN29-3: Annual Index of industrial production by branches
Sources:
Statistical Office of the RS, 2013
| 2008 | 2009 | 2010 | 2011 | 2012 | ||
|---|---|---|---|---|---|---|
| Chemicals | [ktoe] | 100 | 90.7 | 97.2 | 102.1 | 104.8 |
| Primary metals | [ktoe] | 100 | 70.3 | 80.1 | 89.7 | 88.6 |
| Non-metallic mineralls | [ktoe] | 100 | 72.4 | 71.5 | 64.7 | 61.6 |
| Paper | [ktoe] | 100 | 88.1 | 86.3 | 85.8 | 82.5 |
| Food and tobacco | [ktoe] | 100 | 94.1 | 93.8 | 98.3 | 93 |
| Textile | [ktoe] | 100 | 55.4 | 57.2 | 58.9 | 53.4 |
| Machinery | [ktoe] | 100 | 77.1 | 84.5 | 90.9 | 91.8 |
| Transport vehicles | [ktoe] | 100 | 90.8 | 101.4 | 95.6 | 84.3 |
| Wood | [ktoe] | 100 | 75.5 | 79.5 | 75.2 | 70.1 |
| Other industries | [ktoe] | 100 | 75.4 | 79.9 | 70.1 | 66.1 |
| Mining | [ktoe] | 100 | 93.1 | 123.5 | 101.5 | 101.1 |
| Construction | [ktoe] | 100 | 86.5 | 71 | 63.6 | 59.3 |
| Total industry | [ktoe] | 100 | 82.7 | 88.5 | 89.7 | 88.7 |


