[OD18] Resource productivity 
[OD18] Resource productivity

Key message

Due to lower construction activity, material productivity in Slovenia increased faster than the EU average in the period 2007-2012. In 2018 it amounted to 1.86 PPS / kg, but the target of 3.5 PPS / kg by 2030, with the revival of construction activity, will be difficult to achieve. Therefore, much more attention needs to be paid to measures for the transition to a circular economy.
Definition
Resource productivity is an indicator expressing the ratio between gross domestic product (GDP) and domestic material consumption (DMC) in relation to weight. It is one of the most important indicators measuring the efficiency of resource use.
Charts
Figure OD18-1: Resource productivity (PPS/kg)
Sources:
Statistical office of the Republic of Slovenia, 2020
| resource productivity[EUR2010/kg] | |
|---|---|
| 2000 | 0.81 |
| 2001 | 0.85 |
| 2002 | 0.85 |
| 2003 | 0.81 |
| 2004 | 0.84 |
| 2005 | 0.90 |
| 2006 | 0.81 |
| 2007 | 0.79 |
| 2008 | 0.92 |
| 2009 | 1.03 |
| 2010 | 1.11 |
| 2011 | 1.24 |
| 2012 | 1.39 |
| 2013 | 1.40 |
| 2014 | 1.34 |
| 2015 | 1.35 |
| 2016 | 1.44 |
| 2017 | 1.48 |
| 2018 | 1.40 |
Figure OD18-2: Resource productivity in EU countries, GDP/DMC (EUR/kg)
Sources:
Eurostat, 2020
| European Union - 27 countries (from 2020)[EUR/kg] | European Union - 28 countries (2013-2020)[EUR/kg] | Belgium[EUR/kg] | Bulgaria[EUR/kg] | Czechia[EUR/kg] | Denmark[EUR/kg] | Germany (until 1990 former territory of the FRG)[EUR/kg] | Estonia[EUR/kg] | Ireland[EUR/kg] | Greece[EUR/kg] | Spain[EUR/kg] | France[EUR/kg] | Croatia[EUR/kg] | Italy[EUR/kg] | Cyprus[EUR/kg] | Latvia[EUR/kg] | Lithuania[EUR/kg] | Luxembourg[EUR/kg] | Hungary[EUR/kg] | Malta[EUR/kg] | Netherlands[EUR/kg] | Austria[EUR/kg] | Poland[EUR/kg] | Portugal[EUR/kg] | Romania[EUR/kg] | Slovenia[EUR/kg] | Slovakia[EUR/kg] | Finland[EUR/kg] | Sweden[EUR/kg] | United Kingdom[EUR/kg] | Iceland[EUR/kg] | Norway[EUR/kg] | Switzerland[EUR/kg] | North Macedonia[EUR/kg] | Albania[EUR/kg] | Serbia[EUR/kg] | Turkey[EUR/kg] | Bosnia and Herzegovina[EUR/kg] | |
|---|---|---|---|---|---|---|---|---|---|---|---|---|---|---|---|---|---|---|---|---|---|---|---|---|---|---|---|---|---|---|---|---|---|---|---|---|---|---|
| 2000 | 1.45 | 1.52 | 2.00 | 0.24 | 0.64 | 1.65 | 1.62 | 0.49 | 0.99 | 1.24 | 1.26 | 1.99 | 1.05 | 2.07 | 0.83 | 0.81 | 0.63 | 2.76 | 0.67 | 1.48 | 2.80 | 1.57 | 0.46 | 0.83 | 0.48 | 0.81 | 0.77 | 0.90 | 1.67 | 2.15 | 0 | 0 | 4.06 | 0 | 0 | 0 | 0.62 | 0 |
| 2007 | 1.47 | 1.58 | 2.00 | 0.26 | 0.80 | 1.63 | 1.94 | 0.47 | 1.00 | 1.02 | 1.18 | 2.20 | 0.83 | 2.04 | 0.89 | 0.68 | 0.65 | 3.19 | 0.88 | 1.75 | 3.33 | 1.68 | 0.52 | 0.81 | 0.29 | 0.79 | 0.85 | 0.96 | 1.76 | 2.67 | 0 | 2.98 | 4.57 | 0 | 0 | 0.28 | 0.69 | 0 |
| 2018 | 1.92 | 2.07 | 2.89 | 0.32 | 1.10 | 2.05 | 2.29 | 0.44 | 2.38 | 1.59 | 2.75 | 2.81 | 1.15 | 3.30 | 1.30 | 0.84 | 0.75 | 3.67 | 0.81 | 1.62 | 4.43 | 1.89 | 0.65 | 1.07 | 0.38 | 1.40 | 1.15 | 1.07 | 1.77 | 3.91 | 0 | 2.63 | 5.42 | 0.48 | 0 | 0.31 | 0 | 0 |
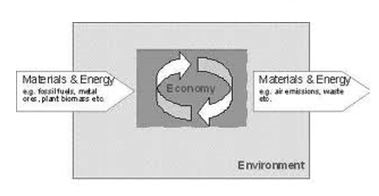
Figure OD18-3: Concept of 'industrial metabolism
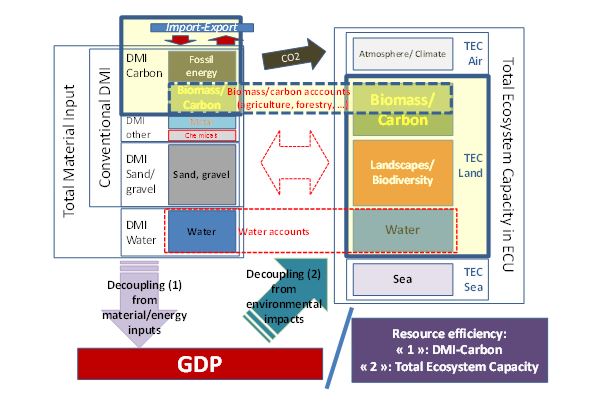
Show dataFigure OD18-4: Scheme of resource flow
Show dataGoals
- To increase resource productivity, to decouple economic growth from resource use, to increase competitiveness and supply reliability;
- To increase resource productivity on 3,5 PPS/kg until 2030;
- To improve the functioning of the economy while reducing pressures on the environment.
Methodology
Date of data source summarization


