[EN10] Final energy consumption by sector

Key message

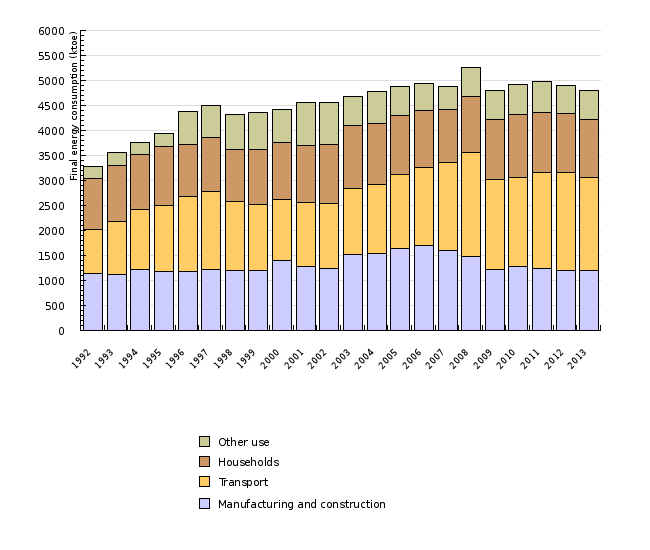
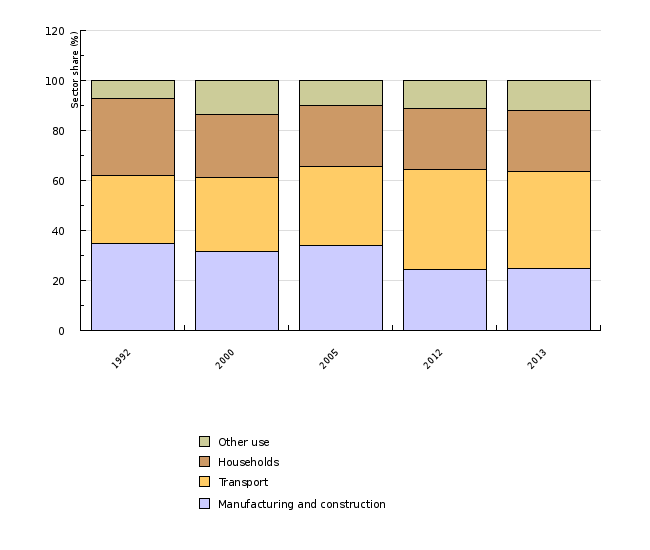
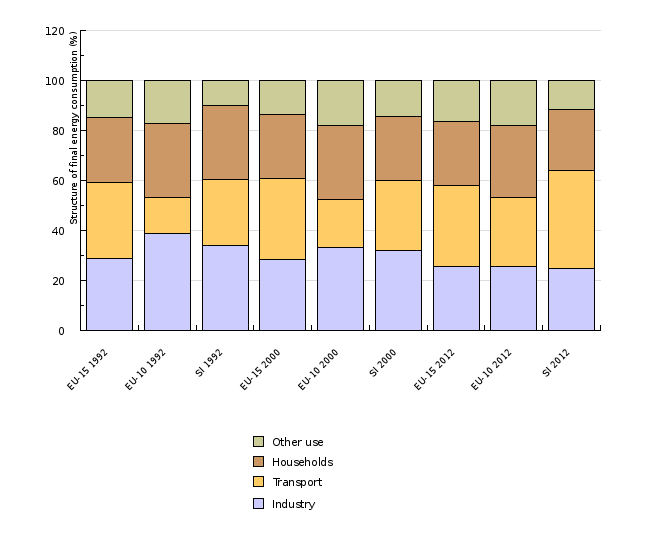
In 2011, final energy consumption was 0.2% higher than in 2010 and 6% lower than in 2008, when it was at the peak in the period. Most of the energy consumed in the transport sector followed by manufacturing, construction and households. The consumption for other use holds the lowest share. Lower use in 2011 compared to 2008 is mainly due to the economic crisis
Definition
The indicator shows final energy consumption that is defined as the sum of final energy consumption of all sectors – manufacturing and construction, transport and wider use, which includes household use, services and agriculture.
Final energy consumption is measured in thousand tonnes of oil equivalent (ktoe). The conversion from mass units is conducted using calorific values of individual types of fuel.
The indicator can be presented in relative (the relative contribution of a specific sector to total final energy consumption) or absolute terms. For absolute values, thousand tonnes of oil equivalent (ktoe) are used.
Charts
Statistical Office of the Republic of Slovenia, 2012; Jožef Stefan Institute, 2012, Eurostat, 2012.
| 1992 | 1993 | 1994 | 1995 | 1996 | 1997 | 1998 | 1999 | 2000 | 2001 | ||
|---|---|---|---|---|---|---|---|---|---|---|---|
| Manufacturing and construction | ktoe | 1142.5 | 1112.1 | 1223.2 | 1179.3 | 1189.4 | 1223.6 | 1203.9 | 1206.7 | 1395.5 | 1277 |
| Transport | ktoe | 885 | 1067.3 | 1189.5 | 1324.7 | 1493.7 | 1561.7 | 1377.8 | 1312 | 1231.1 | 1283.2 |
| Households | ktoe | 1020.3 | 1113.6 | 1104.8 | 1181.5 | 1044.6 | 1069.8 | 1035.4 | 1101.8 | 1124.4 | 1130.3 |
| Other use | ktoe | 230.9 | 267.8 | 241.7 | 257 | 643.5 | 638.6 | 700.5 | 734.1 | 675.9 | 859.7 |
| Final energy consumption - Slovenia | ktoe | 3278.7 | 3560.8 | 3759.2 | 3942.5 | 4371.3 | 4493.7 | 4317.5 | 4354.5 | 4426.9 | 4550.2 |
| Final energy consumption - EU-27 | ktoe | 1061400.8 | 1064697.1 | 1059544.5 | 1078733.4 | 1126258.4 | 1115096.2 | 1124432.7 | 1123820.4 | 1130953.1 | 1154409.4 |
| Final energy consumption - EU-15 | ktoe | 721296.6 | 721194.9 | 718284.2 | 733486 | 763845.7 | 760470.3 | 776729.8 | 781357.2 | 790372.1 | 810694.3 |
| Final energy consumption - EU-10 | ktoe | 33464.4 | 32889.8 | 33883.2 | 34506.9 | 36745.1 | 36495 | 37396.4 | 37195.8 | 37637.5 | 38080.6 |
| 2002 | 2003 | 2004 | 2005 | 2006 | 2007 | 2008 | 2009 | 2010 | 2011 | ||
| Manufacturing and construction | ktoe | 1238.2 | 1514.6 | 1536.1 | 1647 | 1698.1 | 1607.9 | 1484.8 | 1219.7 | 1271.1 | 1234.1 |
| Transport | ktoe | 1311.6 | 1326.6 | 1376.9 | 1469 | 1553.3 | 1760.2 | 2070.9 | 1794.2 | 1790.2 | 1918.7 |
| Households | ktoe | 1163.2 | 1249.5 | 1232.1 | 1185.7 | 1158.1 | 1048.1 | 1114.9 | 1209.7 | 1251.7 | 1208.8 |
| Other use | ktoe | 842.3 | 596.2 | 637.8 | 568.4 | 532.4 | 466.1 | 594.9 | 583.8 | 608.6 | 616.5 |
| Final energy consumption - Slovenia | ktoe | 4555.2 | 4686.9 | 4783 | 4870.2 | 4941.9 | 4882.3 | 5265.5 | 4807.4 | 4921.5 | 4978.2 |
| Final energy consumption - EU-27 | ktoe | 1142226.3 | 1173678 | 1186570.1 | 1188508.3 | 1190094.3 | 1170359.1 | 1174571.4 | 1107844.8 | 1159826.4 | 1107981.5 |
| Final energy consumption - EU-15 | ktoe | 805375.7 | 829258.1 | 837014 | 838194.6 | 838480.8 | 821957.5 | 829393.5 | 782353.8 | 818365 | 782690.9 |
| Final energy consumption - EU-10 | ktoe | 36329.5 | 38456.5 | 37825.6 | 36753.5 | 36306.1 | 34809.4 | 37781.5 | 34624.4 | 37540.7 | 37834.7 |
| 2012 | 2013 | ||||||||||
| Manufacturing and construction | ktoe | 1203.3 | 1194.5 | ||||||||
| Transport | ktoe | 1953 | 1861.6 | ||||||||
| Households | ktoe | 1180.5 | 1157.1 | ||||||||
| Other use | ktoe | 556.8 | 579.9 | ||||||||
| Final energy consumption - Slovenia | ktoe | 4893.7 | 4793 | ||||||||
| Final energy consumption - EU-27 | ktoe | 1104480 | |||||||||
| Final energy consumption - EU-15 | ktoe | 778810.1 | |||||||||
| Final energy consumption - EU-10 | ktoe | 36596.5 |
Statistical Office of the Republic of Slovenia, 2012; Jožef Stefan Institute, 2012.
| 1992 | 2000 | 2005 | 2012 | 2013 | ||
|---|---|---|---|---|---|---|
| Final energy consumption | ktoe | 3278.7 | 4427.1 | 4870.1 | 4893.7 | 4793 |
| Manufacturing and construction | ktoe | 1142.5 | 1395.5 | 1647 | 1203.3 | 1194.5 |
| Transport | ktoe | 885 | 1308.5 | 1543.4 | 1953 | 1861.6 |
| Households | ktoe | 1020.3 | 1124.7 | 1185.7 | 1180.5 | 1157.1 |
| Other use | ktoe | 230.9 | 598.4 | 494 | 556.8 | 579.9 |
| Final energy consumption | % | 100 | 100 | 100 | 100 | 100 |
| Manufacturing and construction | % | 34.8 | 31.5 | 33.8 | 24.6 | 24.9 |
| Transport | % | 27 | 29.6 | 31.7 | 39.9 | 38.8 |
| Households | % | 31.1 | 25.4 | 24.3 | 24.1 | 24.1 |
| Other use | % | 7 | 13.5 | 10.1 | 11.4 | 12.1 |
Statistical Office of the Republic of Slovenia, 2012; Jožef Stefan Institute, 2012.
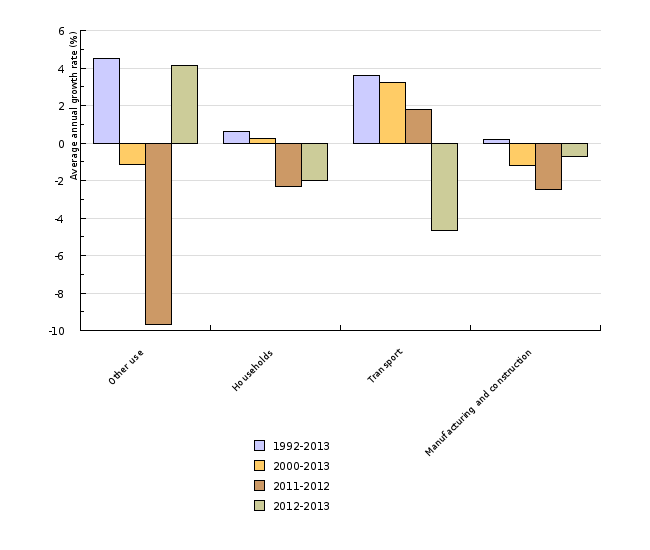
| Other use | Households | Transport | Manufacturing and construction | ||
|---|---|---|---|---|---|
| 1992-2013 | % | 4.5 | 0.6 | 3.6 | 0.2 |
| 2000-2013 | % | -1.2 | 0.2 | 3.2 | -1.2 |
| 2011-2012 | % | -9.7 | -2.3 | 1.8 | -2.5 |
| 2012-2013 | % | 4.2 | -2 | -4.7 | -0.7 |
Eurostat, 2012.
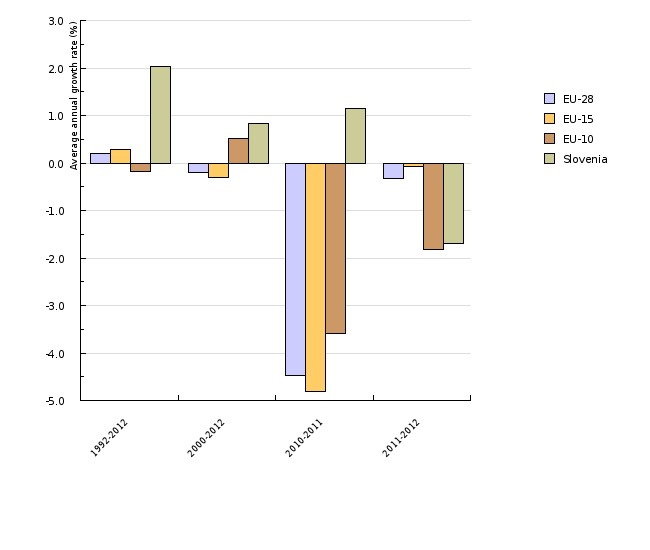
| 1992-2012 | 2000-2012 | 2010-2011 | 2011-2012 | ||
|---|---|---|---|---|---|
| EU-28 | % | 0.2 | -0.2 | -4.5 | -0.3 |
| EU-15 | % | 0.3 | -0.3 | -4.8 | -0.1 |
| EU-10 | % | -0.2 | 0.5 | -3.6 | -1.8 |
| Slovenia | % | 2 | 0.8 | 1.2 | -1.7 |
Eurostat, 2012.
| EU-15 1992 | EU-10 1992 | SI 1992 | EU-15 2000 | EU-10 2000 | SI 2000 | EU-15 2012 | EU-10 2012 | SI 2012 | ||
|---|---|---|---|---|---|---|---|---|---|---|
| Industry | % | 28.7 | 38.9 | 33.9 | 28.5 | 33.1 | 31.9 | 25.5 | 25.6 | 24.8 |
| Transport | % | 30.6 | 14.2 | 26.5 | 32.4 | 19.3 | 28.2 | 32.6 | 27.5 | 39.3 |
| Households | % | 26.1 | 29.6 | 29.7 | 25.3 | 29.5 | 25.3 | 25.5 | 29.1 | 24.4 |
| Other use | % | 14.6 | 17.2 | 9.9 | 13.8 | 18 | 14.5 | 16.3 | 17.8 | 11.5 |
| Industry | ktoe | 253604.6 | 53132.4 | 1152.9 | 276722.9 | 40972.5 | 1423.8 | 238563.8 | 33675.7 | 1203.9 |
| Transport | ktoe | 269807.6 | 19412 | 901.3 | 314257.6 | 23830.2 | 1259 | 305080.6 | 36207.6 | 1906.8 |
| Households | ktoe | 230245.2 | 40408.6 | 1009.9 | 245579.6 | 36528.8 | 1127 | 238589.1 | 38321.4 | 1186.7 |
| Other use | ktoe | 129019.3 | 23473.3 | 337 | 133512.8 | 22301.1 | 647.5 | 152747 | 23447.5 | 557.6 |
| Final energy consumption | ktoe | 882676.7 | 136426.3 | 3401.1 | 970072.9 | 123632.6 | 4457.3 | 934980.5 | 131652.2 | 4855 |
Evropski statistični urad, 2014
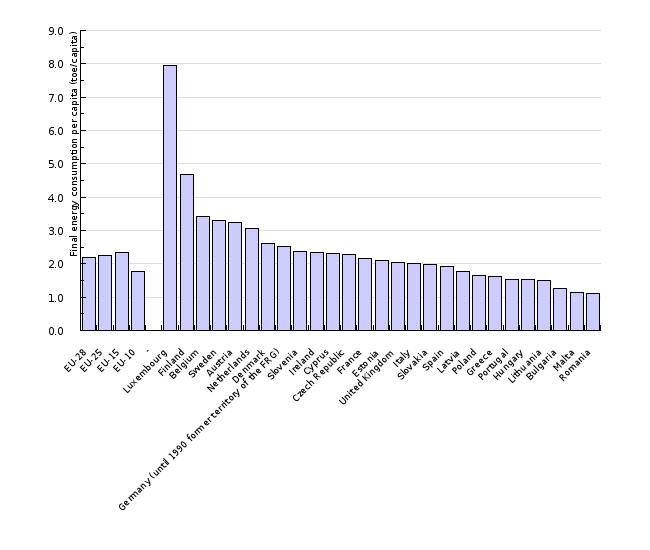
| EU-28 | EU-25 | EU-15 | EU-10 | - | Luxembourg | Finland | Belgium | Sweden | Austria | ||
|---|---|---|---|---|---|---|---|---|---|---|---|
| 2000 | toe/capita | 2.3 | 2.4 | 2.6 | 1.6 | 8.1 | 4.8 | 3.6 | 3.9 | 3 | |
| 2001 | toe/capita | 2.4 | 2.5 | 2.6 | 1.7 | 8.4 | 4.8 | 3.7 | 3.9 | 3.1 | |
| 2002 | toe/capita | 2.3 | 2.4 | 2.6 | 1.7 | 8.4 | 4.9 | 3.5 | 3.8 | 3.1 | |
| 2003 | toe/capita | 2.4 | 2.5 | 2.6 | 1.7 | 8.7 | 5 | 3.7 | 3.8 | 3.3 | |
| 2004 | toe/capita | 2.4 | 2.5 | 2.7 | 1.8 | 9.6 | 5.1 | 3.6 | 3.8 | 3.3 | |
| 2005 | toe/capita | 2.4 | 2.5 | 2.6 | 1.8 | 9.6 | 4.9 | 3.5 | 3.7 | 3.4 | |
| 2006 | toe/capita | 2.4 | 2.5 | 2.6 | 1.8 | 9.3 | 5.1 | 3.4 | 3.7 | 3.4 | |
| 2007 | toe/capita | 2.4 | 2.4 | 2.5 | 1.8 | 9.1 | 5.1 | 3.3 | 3.7 | 3.3 | |
| 2008 | toe/capita | 2.4 | 2.4 | 2.5 | 1.8 | 9 | 4.9 | 3.5 | 3.5 | 3.4 | |
| 2009 | toe/capita | 2.2 | 2.3 | 2.4 | 1.8 | 8.2 | 4.5 | 3.2 | 3.4 | 3.2 | |
| 2010 | toe/capita | 2.3 | 2.4 | 2.5 | 1.9 | 8.6 | 5 | 3.4 | 3.7 | 3.4 | |
| 2011 | toe/capita | 2.2 | 2.3 | 2.3 | 1.8 | 8.4 | 4.7 | 3.6 | 3.4 | 3.3 | |
| 2012 | toe/capita | 2.2 | 2.2 | 2.3 | 1.8 | 8 | 4.7 | 3.4 | 3.3 | 3.3 | |
| Netherlands | Denmark | Germany (until 1990 former territory of the FRG) | Slovenia | Ireland | Cyprus | Czech Republic | France | Estonia | United Kingdom | ||
| 2000 | toe/capita | 3.2 | 2.8 | 2.7 | 2.2 | 2.8 | 2.4 | 2.4 | 2.6 | 1.8 | 2.6 |
| 2001 | toe/capita | 3.2 | 2.8 | 2.7 | 2.3 | 2.9 | 2.4 | 2.4 | 2.6 | 1.9 | 2.6 |
| 2002 | toe/capita | 3.2 | 2.8 | 2.7 | 2.3 | 2.9 | 2.4 | 2.4 | 2.6 | 1.9 | 2.5 |
| 2003 | toe/capita | 3.2 | 2.8 | 2.8 | 2.3 | 2.9 | 2.5 | 2.5 | 2.6 | 2 | 2.5 |
| 2004 | toe/capita | 3.2 | 2.8 | 2.8 | 2.4 | 2.9 | 2.5 | 2.6 | 2.6 | 2.1 | 2.6 |
| 2005 | toe/capita | 3.2 | 2.9 | 2.8 | 2.4 | 3 | 2.4 | 2.5 | 2.6 | 2.1 | 2.5 |
| 2006 | toe/capita | 3.1 | 2.9 | 2.8 | 2.5 | 3.1 | 2.4 | 2.6 | 2.5 | 2.1 | 2.5 |
| 2007 | toe/capita | 3 | 2.9 | 2.6 | 2.4 | 3.1 | 2.4 | 2.5 | 2.5 | 2.3 | 2.4 |
| 2008 | toe/capita | 3.1 | 2.8 | 2.7 | 2.6 | 3 | 2.5 | 2.5 | 2.5 | 2.3 | 2.4 |
| 2009 | toe/capita | 3.1 | 2.7 | 2.6 | 2.4 | 2.6 | 2.4 | 2.3 | 2.4 | 2.1 | 2.2 |
| 2010 | toe/capita | 3.3 | 2.8 | 2.7 | 2.4 | 2.6 | 2.4 | 2.4 | 2.5 | 2.2 | 2.3 |
| 2011 | toe/capita | 3 | 2.6 | 2.5 | 2.4 | 2.4 | 2.4 | 2.3 | 2.3 | 2.1 | 2.1 |
| 2012 | toe/capita | 3.1 | 2.6 | 2.5 | 2.4 | 2.3 | 2.3 | 2.3 | 2.2 | 2.1 | 2 |
| Italy | Slovakia | Spain | Latvia | Poland | Greece | Portugal | Hungary | Lithuania | Bulgaria | ||
| 2000 | toe/capita | 2.2 | 2 | 2 | 1.4 | 1.4 | 1.7 | 1.7 | 1.6 | 1.1 | 1.1 |
| 2001 | toe/capita | 2.2 | 2 | 2.1 | 1.5 | 1.5 | 1.8 | 1.8 | 1.7 | 1.1 | 1.1 |
| 2002 | toe/capita | 2.2 | 2.1 | 2.1 | 1.5 | 1.4 | 1.8 | 1.8 | 1.7 | 1.2 | 1.1 |
| 2003 | toe/capita | 2.3 | 2 | 2.2 | 1.6 | 1.5 | 1.9 | 1.8 | 1.7 | 1.2 | 1.2 |
| 2004 | toe/capita | 2.3 | 2 | 2.2 | 1.7 | 1.5 | 1.8 | 1.8 | 1.7 | 1.3 | 1.2 |
| 2005 | toe/capita | 2.3 | 2.1 | 2.3 | 1.7 | 1.5 | 1.9 | 1.8 | 1.8 | 1.3 | 1.3 |
| 2006 | toe/capita | 2.3 | 2 | 2.2 | 1.8 | 1.6 | 1.9 | 1.8 | 1.8 | 1.4 | 1.4 |
| 2007 | toe/capita | 2.2 | 2 | 2.2 | 1.9 | 1.6 | 2 | 1.8 | 1.7 | 1.5 | 1.3 |
| 2008 | toe/capita | 2.2 | 2 | 2.1 | 1.8 | 1.6 | 1.9 | 1.7 | 1.7 | 1.5 | 1.3 |
| 2009 | toe/capita | 2 | 1.9 | 1.9 | 1.8 | 1.6 | 1.8 | 1.7 | 1.6 | 1.4 | 1.1 |
| 2010 | toe/capita | 2.1 | 2.1 | 1.9 | 1.9 | 1.7 | 1.7 | 1.7 | 1.7 | 1.4 | 1.2 |
| 2011 | toe/capita | 2 | 2 | 1.9 | 1.8 | 1.7 | 1.7 | 1.6 | 1.6 | 1.4 | 1.2 |
| 2012 | toe/capita | 2 | 2 | 1.9 | 1.8 | 1.7 | 1.6 | 1.5 | 1.5 | 1.5 | 1.3 |
| Malta | Romania | ||||||||||
| 2000 | toe/capita | 1.2 | 1 | ||||||||
| 2001 | toe/capita | 1 | 1 | ||||||||
| 2002 | toe/capita | 0.9 | 1.1 | ||||||||
| 2003 | toe/capita | 1 | 1.1 | ||||||||
| 2004 | toe/capita | 1.1 | 1.1 | ||||||||
| 2005 | toe/capita | 1 | 1.2 | ||||||||
| 2006 | toe/capita | 0.9 | 1.2 | ||||||||
| 2007 | toe/capita | 0.9 | 1.1 | ||||||||
| 2008 | toe/capita | 1.2 | 1.2 | ||||||||
| 2009 | toe/capita | 1.1 | 1 | ||||||||
| 2010 | toe/capita | 1.1 | 1 | ||||||||
| 2011 | toe/capita | 1.1 | 1.1 | ||||||||
| 2012 | toe/capita | 1.1 | 1.1 |
Goals
- the trend in final energy consumption should enable the 8 % reduction in greenhouse gas emissions objective to be met;
- the implementation of measures aimed at facilitating efficient use should result in saving 9 % of total energy consumption by 2016;
- a 25 % use of renewable energy sources in final energy consumption by 2020.


