[ZR02] Emissions of nitrogen oxides 

Definition
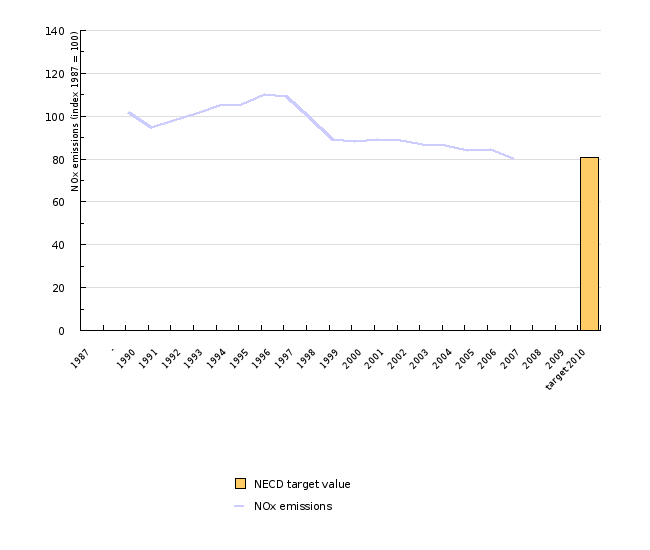
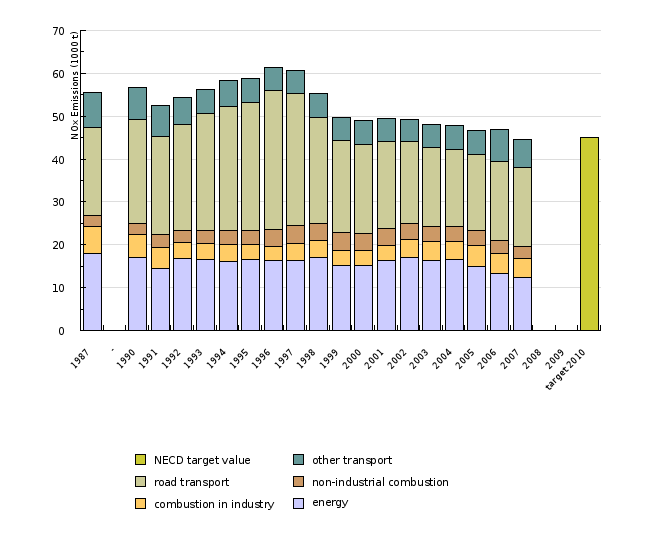
The indicator shows the trend in quantities of total nitrogen oxide (NOx) emissions in Slovenia and main source categories. The quantities of emissions are calculated in accordance with the methodology for creating the National Emission Inventory, based on the CORINAIR methodology. The emissions are shown in a time series from 1990 to 2003.
Charts
National Emission Inventory, Environmental Agency of the Republic of Slovenia, 2008
| 1987 | - | 1990 | 1991 | 1992 | 1993 | 1994 | 1995 | 1996 | 1997 | ||
|---|---|---|---|---|---|---|---|---|---|---|---|
| NOx emissions | t | 55580 | 0 | 56671 | 52602 | 54356 | 56165 | 58448 | 58685 | 61303 | 60578 |
| NOx emissions | index (1987 = 100) | 100 | 101.962936308 | 94.6419575387 | 97.7977689816 | 101.052536884 | 105.160129543 | 105.586541922 | 110.296869377 | 108.992443325 | |
| NECD target value | index (1987 = 100) | ||||||||||
| 1998 | 1999 | 2000 | 2001 | 2002 | 2003 | 2004 | 2005 | 2006 | 2007 | ||
| NOx emissions | t | 55349 | 49603 | 49014 | 49578 | 49207 | 48179 | 47877 | 46657 | 46831 | 44613 |
| NOx emissions | index (1987 = 100) | 99.5843828715 | 89.2461317021 | 88.1863979849 | 89.2011514933 | 88.5336451961 | 86.684059014 | 86.1406980928 | 83.9456639079 | 84.2587261605 | 80.2680820439 |
| NECD target value | index (1987 = 100) | ||||||||||
| 2008 | 2009 | target 2010 | |||||||||
| NOx emissions | t | 45000 | |||||||||
| NOx emissions | index (1987 = 100) | ||||||||||
| NECD target value | index (1987 = 100) | 80.9643756747 |
National Emission Inventory, Environmental Agency of the Republic of Slovenia, 2008
| 1987 | - | 1990 | 1991 | 1992 | 1993 | 1994 | 1995 | 1996 | 1997 | ||
|---|---|---|---|---|---|---|---|---|---|---|---|
| energy | 1000 t | 17.949 | 17.092 | 14.559 | 16.888 | 16.613 | 16.052 | 16.572 | 16.316 | 16.315 | |
| combustion in industry | 1000 t | 6.299 | 5.325 | 4.911 | 3.737 | 3.636 | 4.041 | 3.471 | 3.287 | 4.097 | |
| non-industrial combustion | 1000 t | 2.62 | 2.457 | 2.933 | 2.606 | 3.032 | 3.187 | 3.299 | 3.933 | 4.049 | |
| road transport | 1000 t | 20.407 | 24.273 | 22.817 | 24.859 | 27.417 | 28.922 | 29.786 | 32.368 | 30.816 | |
| other transport | 1000 t | 8.305 | 7.524 | 7.382 | 6.266 | 5.467 | 6.246 | 5.557 | 5.399 | 5.301 | |
| 1998 | 1999 | 2000 | 2001 | 2002 | 2003 | 2004 | 2005 | 2006 | 2007 | ||
| energy | 1000 t | 17.011 | 15.135 | 15.185 | 16.218 | 17.128 | 16.431 | 16.676 | 14.998 | 13.194 | 12.47 |
| combustion in industry | 1000 t | 3.905 | 3.502 | 3.473 | 3.677 | 4.095 | 4.308 | 4.053 | 4.788 | 4.71 | 4.406 |
| non-industrial combustion | 1000 t | 4.081 | 4.333 | 4.016 | 3.949 | 3.791 | 3.601 | 3.613 | 3.45 | 3.156 | 2.688 |
| road transport | 1000 t | 24.77 | 21.442 | 20.644 | 20.354 | 18.992 | 18.352 | 17.986 | 17.904 | 18.485 | 18.585 |
| other transport | 1000 t | 5.582 | 5.191 | 5.696 | 5.38 | 5.201 | 5.487 | 5.549 | 5.517 | 7.286 | 6.465 |
| 2008 | 2009 | target 2010 | |||||||||
| energy | 1000 t | ||||||||||
| combustion in industry | 1000 t | ||||||||||
| non-industrial combustion | 1000 t | ||||||||||
| road transport | 1000 t | ||||||||||
| other transport | 1000 t |
Goals
The target is to reduce NOx emissions to the target value 45 000, as required by the Protocol on the Reduction of Acidification, Eutrophication and Ground Ozone, and Directive 2001/81/EC on National Emissions Ceilings for Certain Atmospheric Pollutants (NECD). Air emission management and reduction is also a target of the National Environmental Action Programme.
Comment
Compared to the situation in 1990, NOx emissions in Slovenia dropped by 9% in 2002. This reduction is the result of an increased portion of vehicles with catalytic converters. With the 56% share of NOx emissions, road traffic remains the principal source of pollution.
Methodology
The data are taken from the National Emission Inventory database. The database maintained at the Environmental Agency of the Republic of Slovenia contains emission assessments that are made on the basis of statistical data (on sold fuels, industrial production, agricultural activities, etc.) by using emission factors.


