[VD05] Nitrates in groundwater

Key message

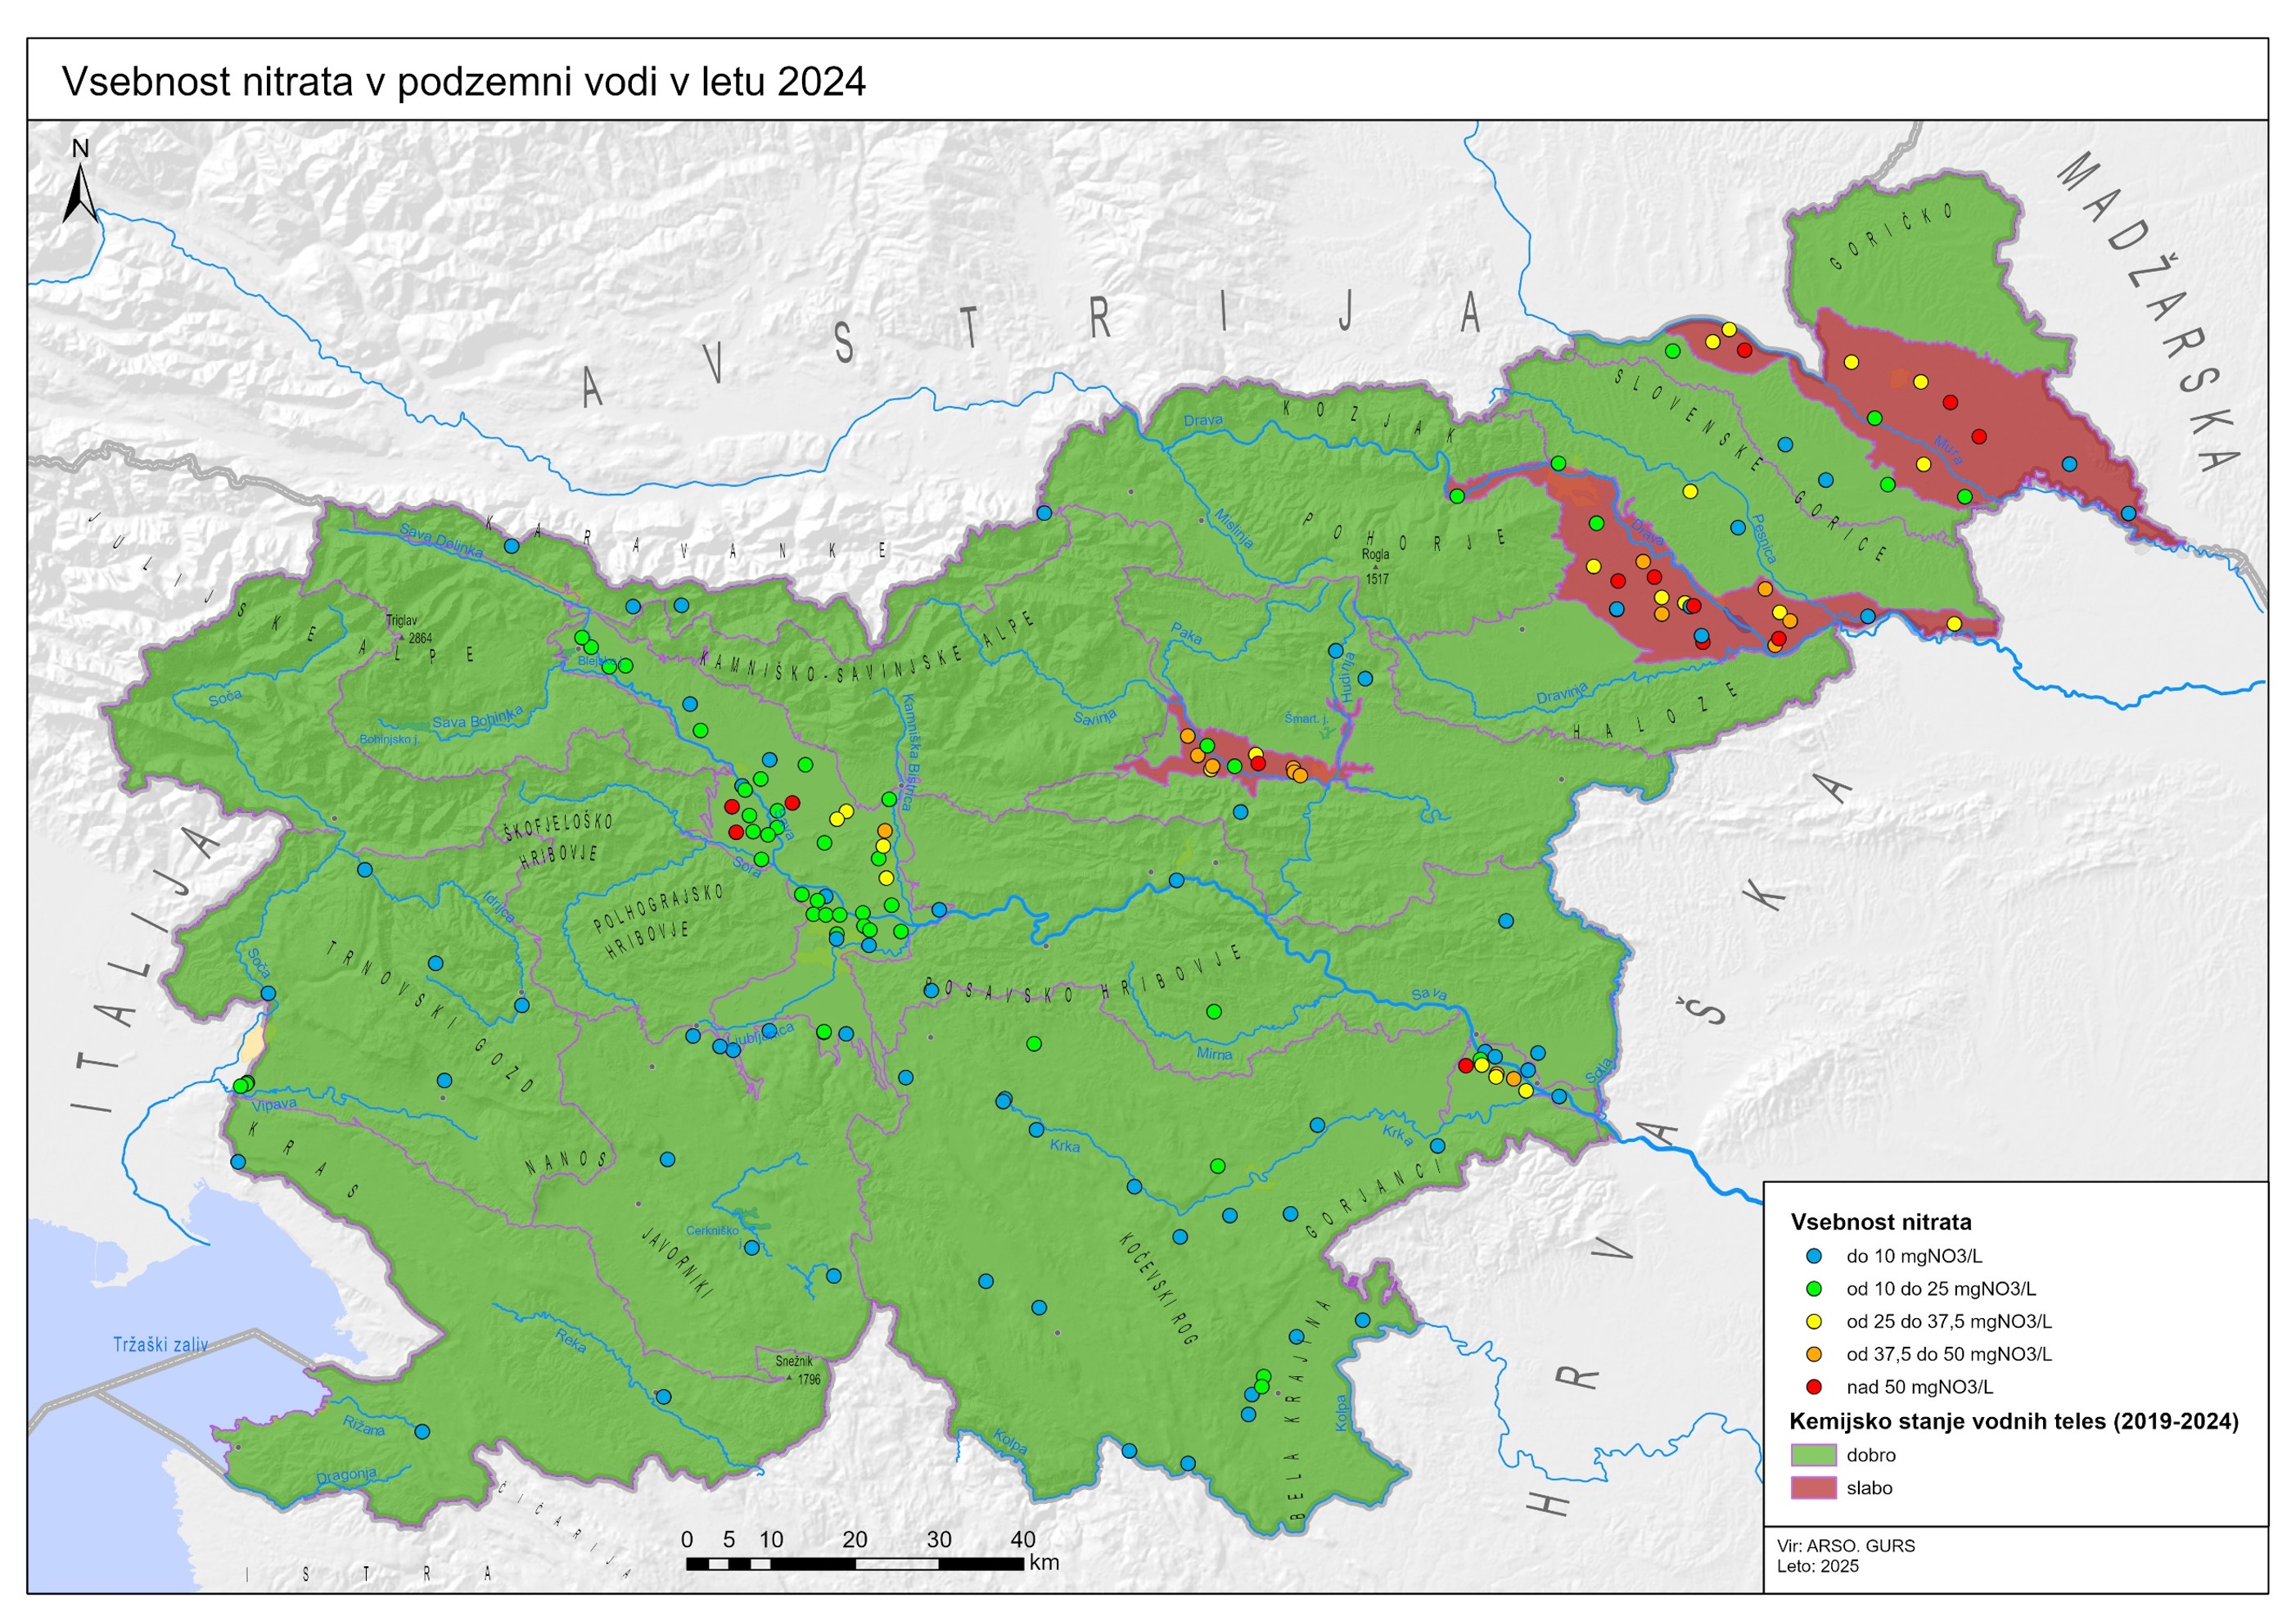
Groundwater in intergranular aquifers in Slovenia is most affected by nitrate pollution, particularly in northeastern Slovenia. In contrast, groundwater in karst and fissured aquifers is less impacted due to geographical conditions, lower population density, and a smaller proportion of agricultural land.
For the period 2019–2024, poor chemical status was identified in the water bodies of the Savinja, Drava, and Mura basins. The main cause of poor chemical status in all water bodies was nitrate, with atrazine additionally contributing in the Drava basin.
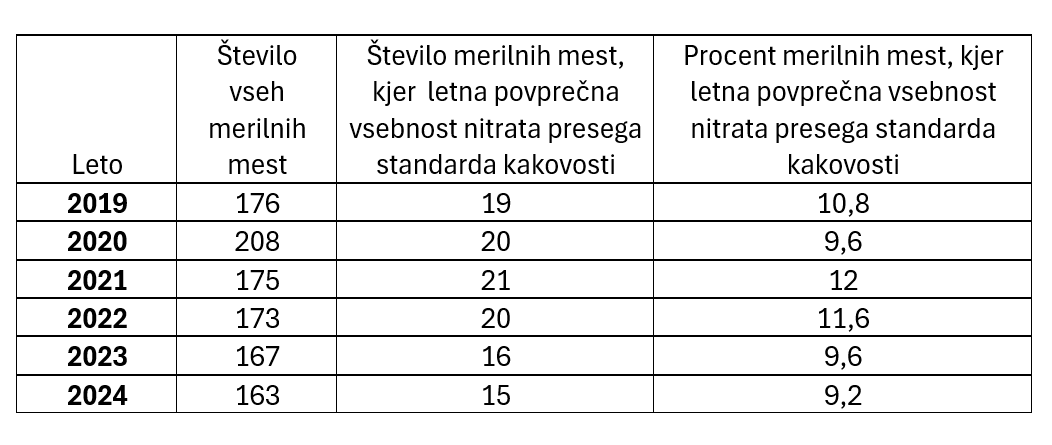
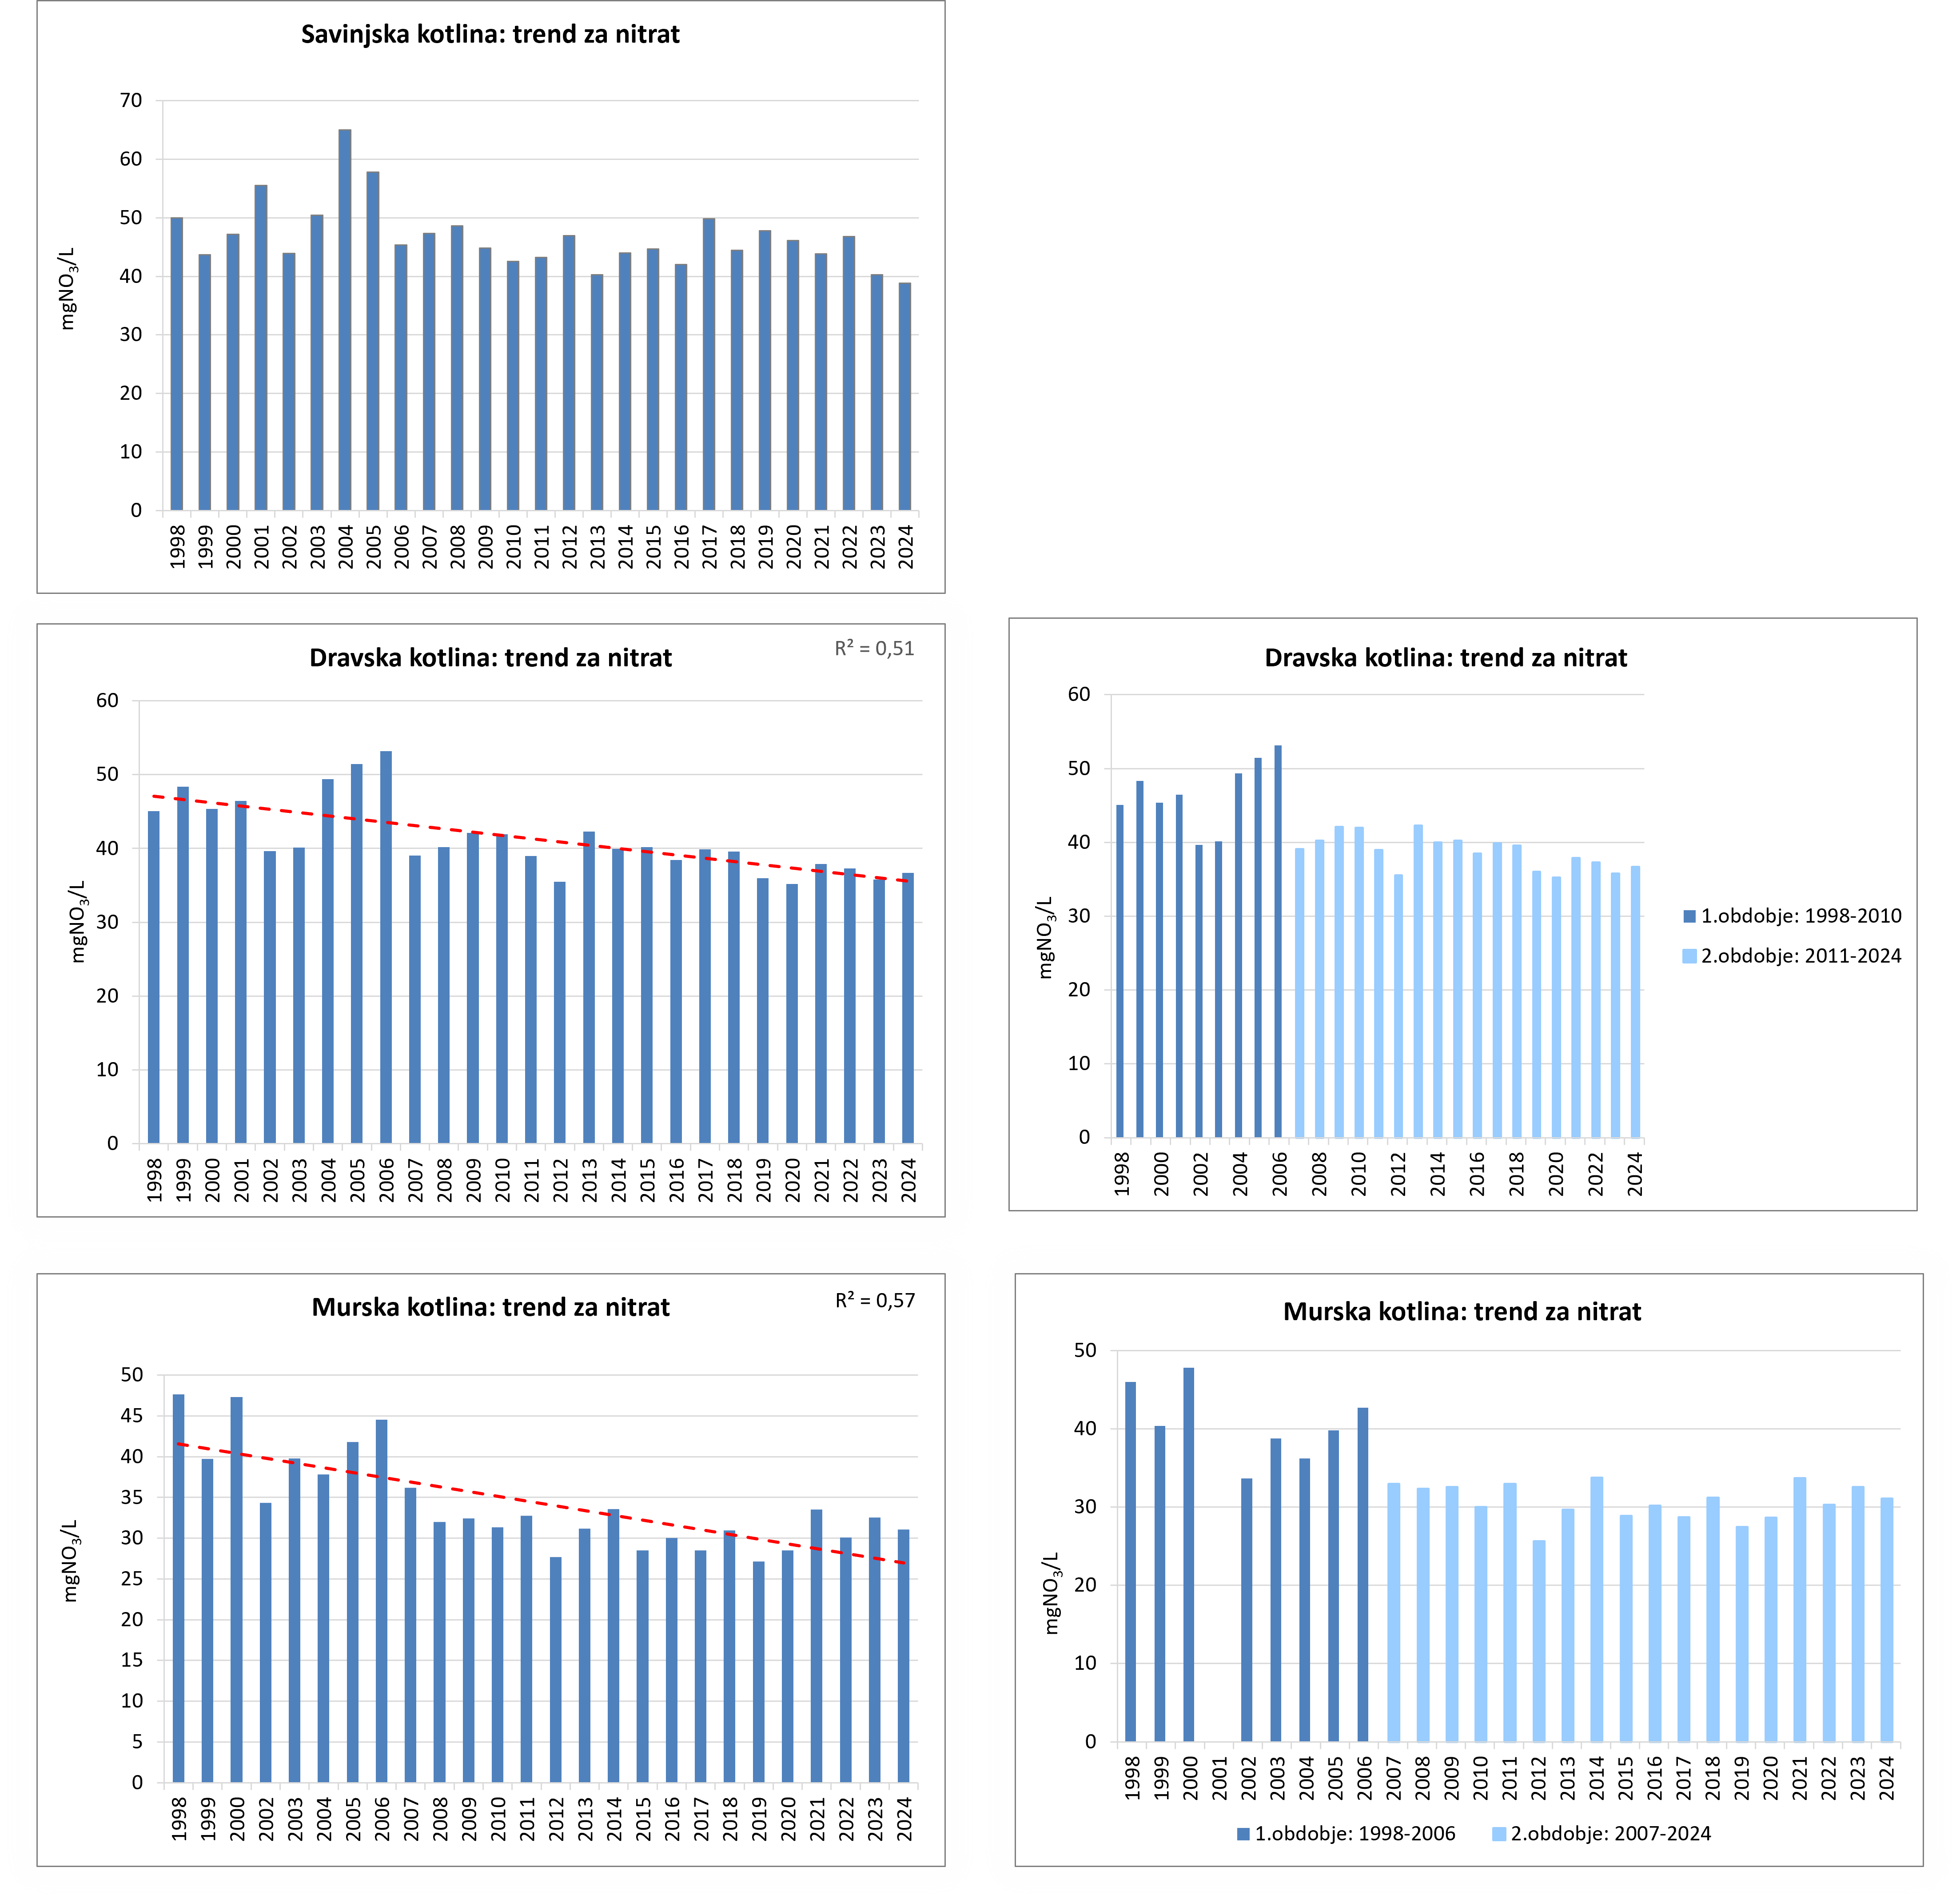
In recent years, the number of monitoring sites where the annual average nitrate concentration exceeds the quality standard of 50 mg NO₃/L has been decreasing. Statistically significant downward trends in nitrate concentrations during the period 1998–2024 were observed in the Drava and Mura basin water bodies. In the Savinja basin water body, no statistically significant trend was detected over this period.
Definition
This indicator shows:
- Average annual values of nitrate in groundwater samples in Europe and Slovenia and at the sampling points of the Slovenian national monitoring in 2020.
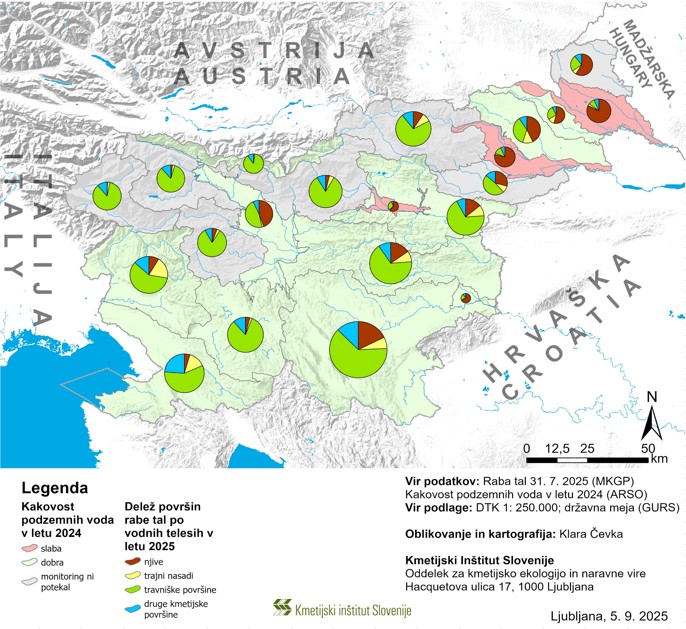
- Structure of agricultural land use and groundwater quality in the analzyed year.
-
Share of agricultural area in the surface of ground water bodies in Slovenia in the analyzed year.
-
Total annual nitrogen emissions from municipal wastewater treatment plants.
Charts
ARSO, GURS (2025)
Standardised Database for Water Quality Monitoring, Slovenian Environment Agency; Waterbase European Environment Agency (2025)
| Slovenija - alluvial aquifers[mg/l] | Slovenia - karst-fractured aquifers[mg/l] | Slovenia - average[mg/l] | Europa - average[mg/l] | |
|---|---|---|---|---|
| 2004 | 40.60 | 7.50 | 15.40 | 20.79 |
| 2005 | 40.30 | 7.40 | 15.20 | 20.86 |
| 2006 | 38.60 | 7.40 | 14.80 | 20.88 |
| 2007 | 31.80 | 7.30 | 13.10 | 21.27 |
| 2008 | 32.80 | 6.80 | 13 | 21.39 |
| 2009 | 32.90 | 6.60 | 12.80 | 21.10 |
| 2010 | 31.90 | 5.50 | 11.80 | 21.56 |
| 2011 | 31.20 | 6.60 | 12.50 | 20.72 |
| 2012 | 30.20 | 5.40 | 11.30 | 21.34 |
| 2013 | 32.30 | 5.30 | 11.70 | 21.22 |
| 2014 | 32.20 | 5.30 | 11.70 | 21.32 |
| 2015 | 31.10 | 5.80 | 11.80 | 21.35 |
| 2016 | 25.40 | 5.50 | 11.40 | 21.64 |
| 2017 | 31.70 | 5.90 | 12 | 21.06 |
| 2018 | 32 | 5.60 | 11.90 | 21.18 |
| 2019 | 30.10 | 5.80 | 11.60 | 20.82 |
| 2020 | 29.20 | 6.20 | 11.70 | 20.43 |
| 2021 | 31.60 | 5.80 | 12 | 20.59 |
| 2022 | 31 | 5.20 | 11.40 | 20.65 |
| 2023 | 30.70 | 5.10 | 11.20 | |
| 2024 | 29.70 | 5.50 | 11.30 |
Standardised Database for Water Quality Monitoring, Slovenian Environment Agency (2025)
| 1001 Savska kotlina in Ljubljansko barje[mg/l] | 1002 Savinjska kotlina[mg/l] | 1003 Krška kotlina[mg/l] | 3012 Dravska kotlina[mg/l] | 4016 Murska kotlina[mg/l] | quality standard[mg/l] | |
|---|---|---|---|---|---|---|
| 1998 | 23.40 | 50 | 21.80 | 45.10 | 47.60 | 50 |
| 1999 | 22.80 | 43.80 | 23.80 | 48.40 | 39.80 | 50 |
| 2000 | 21.60 | 47.20 | 20.40 | 45.40 | 47.30 | 50 |
| 2001 | 21.90 | 55.50 | 25.70 | 46.50 | 50 | |
| 2002 | 20.70 | 43.90 | 33 | 39.70 | 34.40 | 50 |
| 2003 | 20.70 | 50.50 | 22.30 | 40.30 | 39.90 | 50 |
| 2004 | 20.90 | 65 | 29.40 | 49.50 | 38 | 50 |
| 2005 | 22.90 | 57.80 | 24.80 | 54 | 42 | 50 |
| 2006 | 22.70 | 45.40 | 26.90 | 53.30 | 44.70 | 50 |
| 2007 | 18.40 | 47.30 | 21.10 | 39.10 | 32.90 | 50 |
| 2008 | 19.60 | 48.70 | 23.20 | 40.30 | 32.20 | 50 |
| 2009 | 20.60 | 44.80 | 24.20 | 42.10 | 32.60 | 50 |
| 2010 | 19.20 | 42.50 | 24.10 | 42.20 | 31.80 | 50 |
| 2011 | 19.20 | 43.20 | 21.60 | 39 | 32.90 | 50 |
| 2012 | 18.20 | 46.90 | 23.70 | 35.60 | 26.70 | 50 |
| 2013 | 18.90 | 40.20 | 28.70 | 42.30 | 31.40 | 50 |
| 2014 | 18.80 | 44 | 24.50 | 40 | 33.70 | 50 |
| 2015 | 18 | 44.70 | 23.60 | 40.30 | 28.70 | 50 |
| 2016 | 16.70 | 42 | 24.50 | 38.50 | 30.30 | 50 |
| 2017 | 16.80 | 49.80 | 24.10 | 39.10 | 28.70 | 50 |
| 2018 | 18.80 | 44.40 | 25.70 | 39.70 | 31.20 | 50 |
| 2019 | 17.50 | 47.80 | 21.90 | 36.10 | 27.40 | 50 |
| 2020 | 16.10 | 46.10 | 19.90 | 35.30 | 28.70 | 50 |
| 2021 | 18.50 | 43.80 | 23.10 | 38.80 | 33.70 | 50 |
| 2022 | 17.10 | 46.80 | 21.80 | 38.70 | 30.40 | 50 |
| 2023 | 19.20 | 40.30 | 24.30 | 36.90 | 32.80 | 50 |
| 2024 | 19.30 | 38.80 | 24.30 | 35.10 | 31.10 | 50 |
Standardised Database for Water Quality Monitoring, Slovenian Environment Agency, (2025)
MM: Merilno mesto
| Vodno telo podzemne vode | Leto | 2017 | 2018 | 2019 | 2020 | 2021 | 2022 |
| 1001 Savska kotlina in Ljubljansko barje | Kemijsko stanje | dobro | dobro | dobro | dobro | dobro | dobro |
| Št. MM | 50 | 48 | 49 | 51 | 48 | 48 | |
| Št. neustreznih MM | 2 | 3 | 2 | 2 | 3 | 0 | |
| 1002 Savinjska kotlina | Kemijsko stanje | slabo | slabo | slabo | slabo | slabo | slabo |
| Št. MM | 13 | 13 | 12 | 13 | 13 | 13 | |
| Št. neustreznih MM | 6 | 3 | 6 | 6 | 5 | 6 | |
| 1003 Krška kotlina | Kemijsko stanje | dobro | dobro | dobro | dobro | dobro | dobro |
| Št. MM | 14 | 14 | 14 | 13 | 13 | 13 | |
| Št. neustreznih MM | 0 | 2 | 0 | 1 | 1 | 1 | |
| 3012 Dravska kotlina | Kemijsko stanje | slabo | slabo | slabo | slabo | slabo | slabo |
| Št. MM | 25 | 27 | 28 | 27 | 26 | 27 | |
| Št. neustreznih MM | 9 | 13 | 9 | 9 | 9 | 11 | |
| 4016 Murska kotlina | Kemijsko stanje | slabo | slabo | slabo | slabo | slabo | slabo |
| Št. MM | 13 | 13 | 13 | 13 | 13 | 13 | |
| Št. neustreznih MM | 2 | 2 | 2 | 2 | 3 | 2 |
Standardised Database for Water Quality Monitoring, Slovenian Environment Agency (2025)
Ministry of Agriculture, Forestry and Food, 2025
| 2025 [%] | |
|---|---|
| Julijske Alpe v porečju Save | 10.38 |
| Karavanke | 11.20 |
| Julijske Alpe v porečju Soče | 15.48 |
| Kamniško-Savinjske Alpe | 17.64 |
| Kraška Ljubljanica | 24.83 |
| Goriška | 25.17 |
| Vzhodne Alpe | 25.67 |
| Cerkljansko, Škofjeloško in Polhograjsko hribovje | 25.89 |
| Dolenjski kras | 27.63 |
| Obala in Kras z Brkini | 31.45 |
| Posavsko hribovje do osrednje Sotle | 34.98 |
| Spodnji del Savinje do Sotle | 38.19 |
| Haloze in Dravinjske gorice | 48 |
| Savska kotlina in Ljubljansko Barje | 52.03 |
| Goričko | 51.80 |
| Vzhodne Slovenske gorice | 58.93 |
| Dravska kotlina | 59.74 |
| Zahodne Slovenske gorice | 63.26 |
| Murska kotlina | 68.67 |
| Savinjska kotlina | 68.38 |
| Krška kotlina | 68.52 |
Waste Water Treatment Plants Database, Environmental Agency of the Republic of Slovenia (2025)
| Indirect outflow into groundwater[t/year] | Outflow into surface waters[t/year] | |
|---|---|---|
| 2010 | 5.90 | 1993.30 |
| 2011 | 6.60 | 2011.40 |
| 2012 | 3.40 | 1710.40 |
| 2013 | 2.40 | 1707.10 |
| 2014 | 4.50 | 1634 |
| 2015 | 5.90 | 1502 |
| 2016 | 9.70 | 1321.40 |
| 2017 | 9.90 | 1315.50 |
| 2018 | 12 | 1388.60 |
| 2019 | 12.80 | 1283.10 |
| 2020 | 10 | 1233.40 |
| 2021 | 12.50 | 1256.90 |
| 2022 | 12 | 1159.30 |
| 2023 | 11.30 | 1074.10 |
Goals
- To improve the state of the water environment,
- to reduce emissions from dispersed sources (intensive agriculture, dispersed settlement without wastewater treatment),
- to achieve a favourable state of groundwater,
- to reduce concentrations of nitrates in overburdened groundwater below 50 mg NO3/l and to reverse the trends of increasing nitrate concentrations.


