[VD05] Nitrates in groundwater

Key message

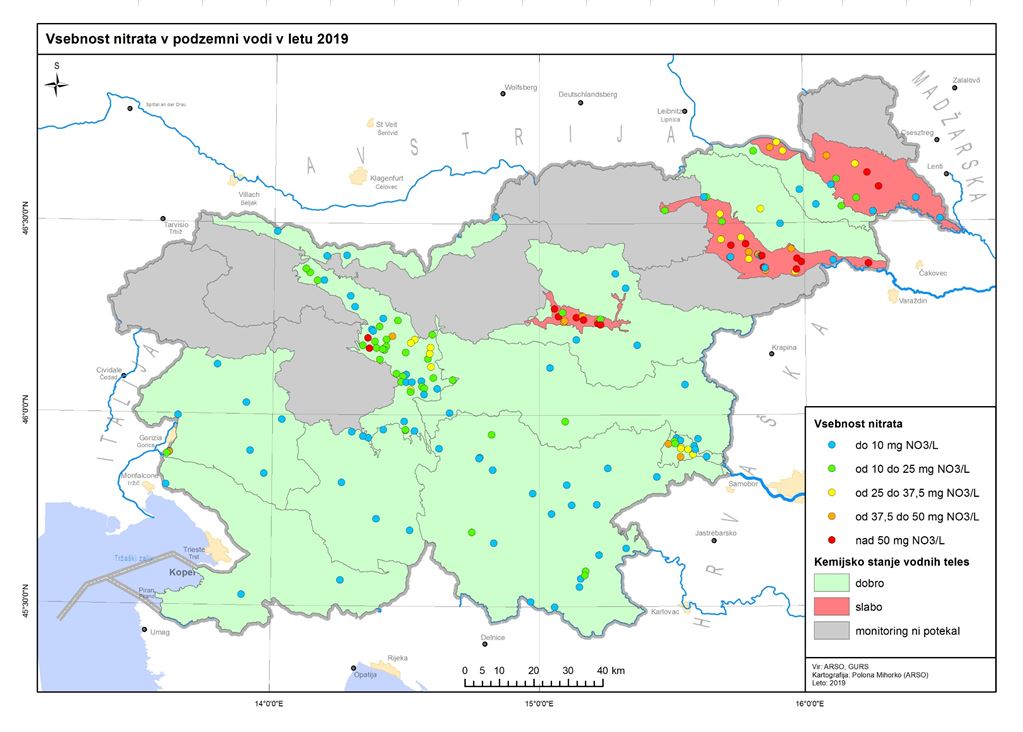
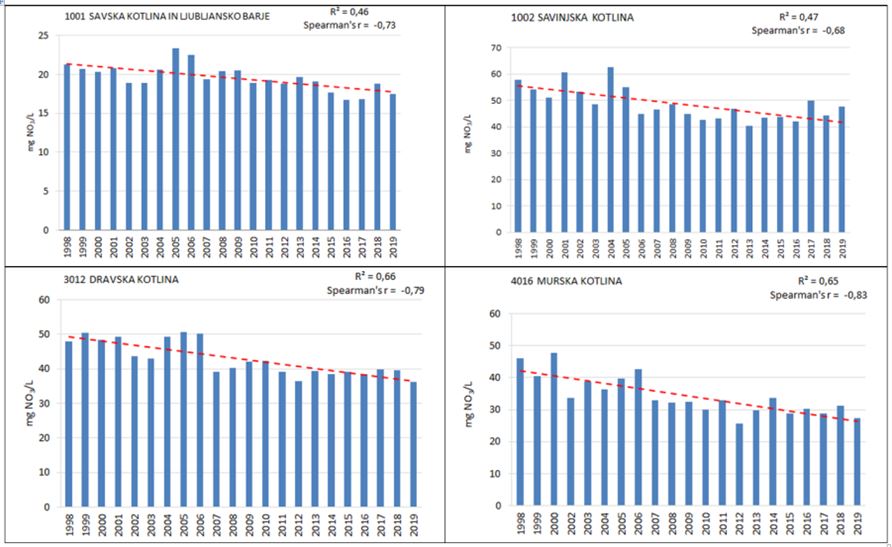
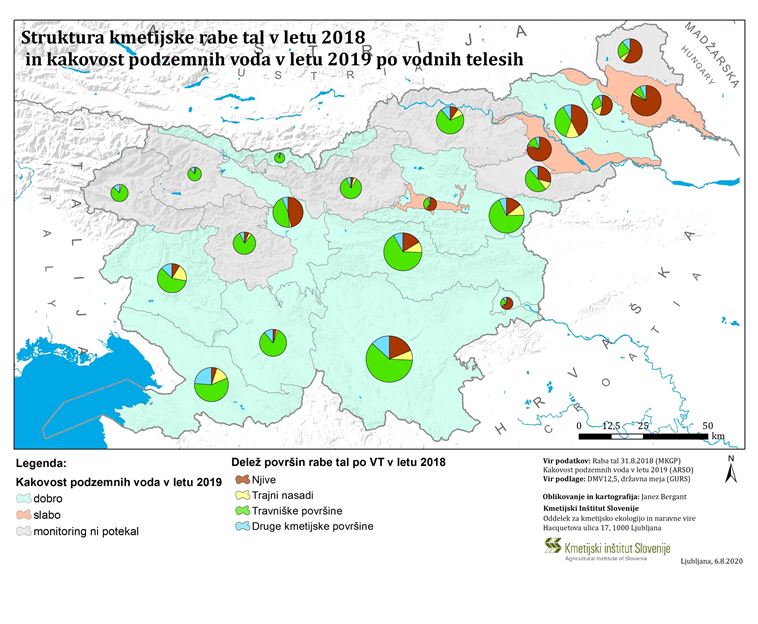
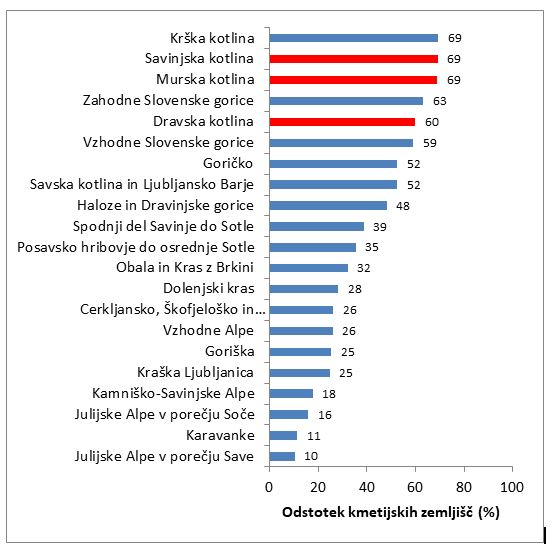
Slovenian groundwater bodies most polluted with nitrates are those with intergranular (alluvium) aquifers, particularly in north-eastern Slovenia. Groundwater in karst and fractured aquifers is less burdened with nitrates due to geographical conditions, low population density and less agricultural land. In the period 1998–2019, the average annual levels of nitrates in water bodies in the Sava valley, Ljubljansko barje, Savinja, Drava and Mura basins show a statistically significant downward trend. In other water bodies, nitrate levels are not statistically significant.
Definition
This indicator shows the concentration of nitrates in groundwater samples. Mean annual values for individual measuring sites, water bodies in Slovenia and Europe, were calculated.
Nitrates can be naturally present in groundwater. Natural background concentrations of nitrates depend on geological properties of aquifers – in Slovenia, they are below 10 mg NO3/l. Increased concentrations of nitrates in groundwater are a result of human activities, agriculture in particular. Nitrates can also appear in groundwater as a consequence of improper urban wastewater management. In Slovenia, groundwater represents the main source of drinking water.
Charts
Standardised Database for Water Quality Monitoring, Slovenian Environmental Agency, 2020
| Slovenija - alluvial aquifers[mg/l] | Slovenia - karst-fractured aquifers[mg/l] | Slovenia - average[mg/l] | Europa - average[mg/l] | |
|---|---|---|---|---|
| 2004 | 40.56 | 7.48 | 15.36 | 20.04 |
| 2005 | 40.29 | 7.39 | 15.23 | 19.72 |
| 2006 | 38.59 | 7.41 | 14.84 | 19.50 |
| 2007 | 31.75 | 7.33 | 13.15 | 19.27 |
| 2008 | 32.77 | 6.78 | 12.97 | 19.20 |
| 2009 | 32.87 | 6.58 | 12.84 | 19.12 |
| 2010 | 31.95 | 5.50 | 11.80 | 19.28 |
| 2011 | 31.20 | 6.60 | 12.50 | 19.28 |
| 2012 | 30.20 | 5.36 | 11.28 | 19.28 |
| 2013 | 32.30 | 5.27 | 11.70 | 19.28 |
| 2014 | 32.21 | 5.27 | 11.69 | 19.28 |
| 2015 | 31.05 | 5.78 | 11.80 | 19.28 |
| 2016 | 25.35 | 5.50 | 11.44 | 19.28 |
| 2017 | 31.73 | 5.90 | 12.05 | 19.28 |
| 2018 | 31.95 | 5.61 | 11.88 | 19.28 |
| 2019 | 30.11 | 5.78 | 11.57 | 19.28 |
| 1001 Savska kotlina in Ljubljansko barje[mg/l] | 1002 Savinjska kotlina[mg/l] | 1003 Krška kotlina[mg/l] | 3012 Dravska kotlina[mg/l] | 4016 Murska kotlina[mg/l] | quality standard[mg/l] | [ ] | |
|---|---|---|---|---|---|---|---|
| 1998 | 23.39 | 50.01 | 21.84 | 45.10 | 47.63 | 50 | 1 |
| 1999 | 22.80 | 43.78 | 23.80 | 48.37 | 39.75 | 50 | |
| 2000 | 21.64 | 47.21 | 20.39 | 45.44 | 47.34 | 50 | |
| 2001 | 21.94 | 55.49 | 25.68 | 46.46 | 50 | ||
| 2002 | 20.68 | 43.88 | 32.96 | 39.70 | 34.43 | 50 | |
| 2003 | 20.70 | 50.45 | 22.34 | 40.29 | 39.86 | 50 | |
| 2004 | 20.90 | 65.03 | 29.44 | 49.45 | 37.98 | 50 | |
| 2005 | 22.90 | 57.83 | 24.76 | 54.01 | 41.99 | 50 | |
| 2006 | 22.70 | 45.37 | 26.94 | 53.25 | 44.67 | 50 | |
| 2007 | 18.38 | 47.29 | 21.10 | 39.12 | 32.88 | 50 | |
| 2008 | 19.57 | 48.65 | 23.16 | 40.28 | 32.20 | 50 | |
| 2009 | 20.63 | 44.83 | 24.19 | 42.13 | 32.57 | 50 | |
| 2010 | 19.21 | 42.52 | 24.05 | 42.18 | 31.78 | 50 | |
| 2011 | 19.20 | 43.20 | 21.60 | 39 | 32.90 | 50 | |
| 2012 | 18.23 | 46.91 | 23.66 | 35.56 | 26.65 | 50 | |
| 2013 | 18.93 | 40.24 | 28.67 | 42.31 | 31.36 | 50 | |
| 2014 | 18.80 | 43.98 | 24.52 | 40.00 | 33.73 | 50 | |
| 2015 | 17.96 | 44.66 | 23.64 | 40.27 | 28.73 | 50 | |
| 2016 | 16.75 | 42.02 | 24.53 | 38.51 | 30.32 | 50 | |
| 2017 | 16.83 | 49.85 | 24.13 | 39.09 | 28.75 | 50 | |
| 2018 | 18.78 | 44.41 | 25.71 | 39.66 | 31.19 | 50 | |
| 2019 | 17.46 | 47.75 | 21.85 | 36.11 | 27.37 | 50 |
Enotna zbirka podatkov monitoringa kakovosti voda (2020)
Environmental Agency of the Republic of Slovenia, 2020. Agricultural Institute of Slovenia (2020)
Ministry of Agriculture, Forestry and Food (2020)
Red coloured bars denote ground water bodies with poor chemical state because the nitrate concentration limit is exceeded.
Waste Water Treatment Plants Database, Environmental Agency of the Republic of Slovenia (2020)
| Indirect outflow into groundwater[t/year] | Outflow into surface waters[t/year] | |
|---|---|---|
| 2010 | 5.90 | 1993.30 |
| 2011 | 6.60 | 2011.40 |
| 2012 | 3.40 | 1710.40 |
| 2013 | 2.40 | 1707.10 |
| 2014 | 4.50 | 1634 |
| 2015 | 5.90 | 1502 |
| 2016 | 9.70 | 1321.40 |
| 2017 | 9.90 | 1315.50 |
| 2018 | 12 | 1388.60 |
| 2019 | 12.80 | 1283.10 |
Goals
- To improve the state of the water environment
- To reduce emissions from dispersed sources (intensive agriculture, dispersed settlement without wastewater treatment)
- To achieve a favourable state of groundwater by 2015
- To reduce concentrations of nitrates in overburdened groundwater below 50 mg NO3/l and to reverse the trends of increasing nitrate concentrations


