[OD13] Packaging waste 

Key message

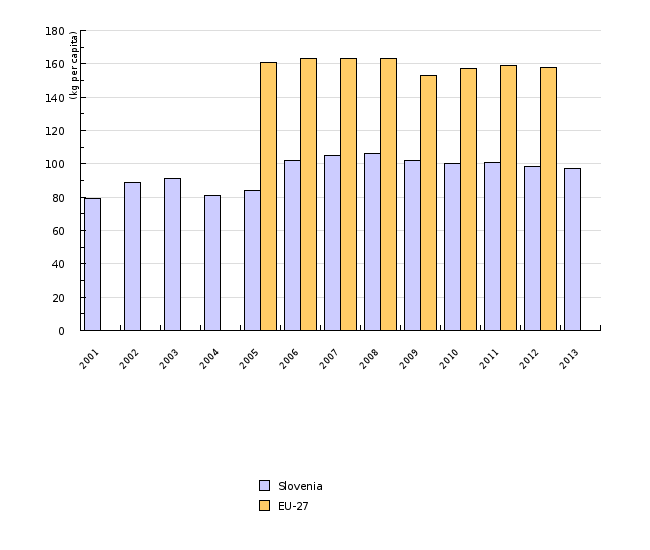
The amount of packaging waste has stabilized in recent years at about 100 kg per capita per year. In 2014, every resident of Slovenia produced 102 kg of packaging waste, which is a few kilos more than in the four preceeding years.
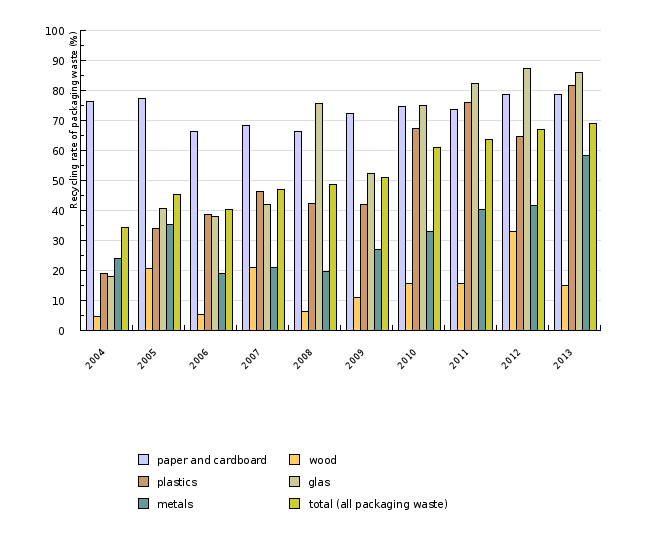
Recovery of packaging waste has been increasing and in 2014 stood at 88%. Recycling is also increasing and in 2014 it reached 70%. Slovenia has reached the EU target – to reuse at least 55% of all packaging materials by the end of 2012.
Definition
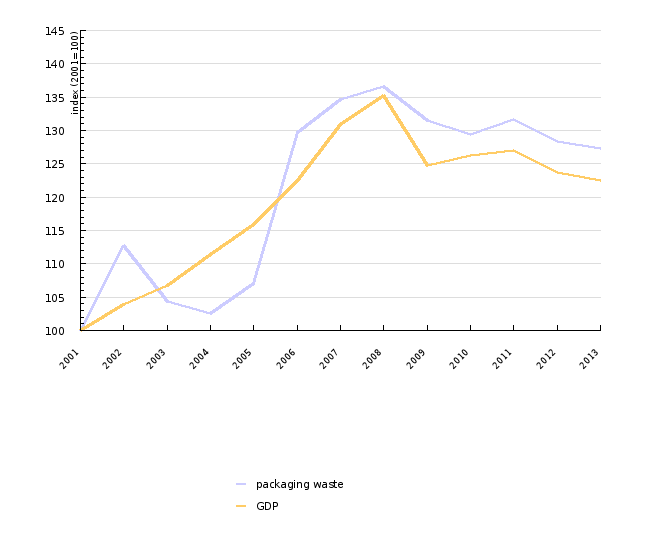
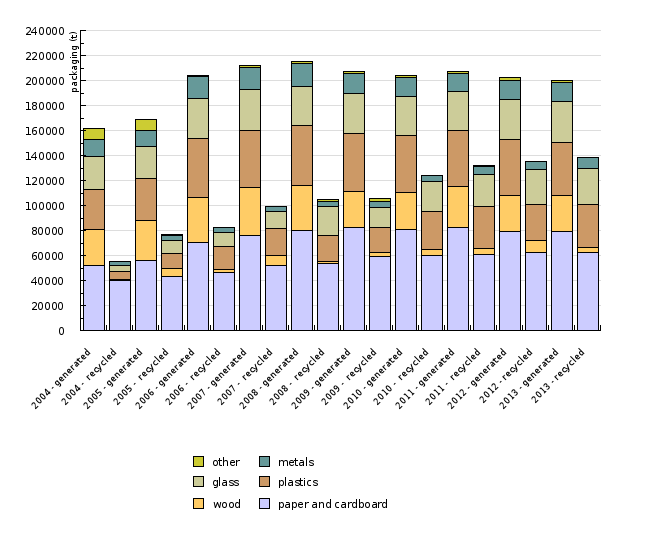
This indicator shows the quantity of packaging waste generated per capita, the connection between the quantity of produced packaging and the GDP, the quantity of produced and recycled packaging waste by material and the shares of recovered and recycled packaging waste.
Packaging is defined as products made of any type of material intended to cover or hold goods (raw materials or final products) for the purpose of storage or protection, handling, delivery or presentation on the route from the packaging facility to the end user (Decree on the management of packaging and packaging waste, Official Gazette of the Republic of Slovenia, Nos 84/06, 106/06 and 110/07). In addition, all products and items listed under Article 3 of this Decree also constitute packaging.
Charts
Analysis of annual reports on waste management in 2008; Waste Management Database, Environmental Agency of the Republic of Slovenia, 2010
| 2001 | 2002 | 2003 | 2004 | 2005 | 2006 | 2007 | 2008 | 2009 | 2010 | ||
|---|---|---|---|---|---|---|---|---|---|---|---|
| Slovenia | kg per capita | 79 | 89 | 91 | 81 | 84 | 102 | 105 | 106 | 102 | 100 |
| EU-15 | kg per capita | 171 | 174 | 180 | 181 | 182 | 184 | 186 | 183 | 172 | 176 |
| EU-27 | kg per capita | 161 | 163 | 163 | 163 | 153 | 157 | ||||
| 2011 | 2012 | 2013 | |||||||||
| Slovenia | kg per capita | 101 | 98 | 97 | |||||||
| EU-15 | kg per capita | ||||||||||
| EU-27 | kg per capita | 159 | 158 |
Analysis of annual reports on waste management in 2008; Waste Management Database, Environmental Agency of the Republic of Slovenia, 2010
| 2001 | 2002 | 2003 | 2004 | 2005 | 2006 | 2007 | 2008 | 2009 | 2010 | ||
|---|---|---|---|---|---|---|---|---|---|---|---|
| packaging waste | t | 157481 | 177547 | 164390 | 161507 | 168630 | 204181 | 212085 | 215110 | 206994 | 203763 |
| GDP | mio EUR | 19460 | 20206 | 20780 | 21685 | 22553 | 23828 | 25482 | 26323 | 24271 | 24567 |
| packaging waste per GDP unit | t/mio EUR | 8 | 9 | 8 | 7 | 7 | 9 | 8 | 8 | 9 | 8 |
| annual changes | % | 9 | -10 | -6 | 0 | 15 | -3 | -2 | 4 | -3 | |
| packaging waste | index (2001=100) | 100 | 113 | 104 | 103 | 107 | 130 | 135 | 137 | 131 | 129 |
| GDP | index (2001=100) | 100 | 104 | 107 | 111 | 116 | 122 | 131 | 135 | 125 | 126 |
| 2011 | 2012 | 2013 | |||||||||
| packaging waste | t | 207396 | 202021 | 200396 | |||||||
| GDP | mio EUR | 24718 | 24065 | 23825 | |||||||
| packaging waste per GDP unit | t/mio EUR | 8 | 8 | 8 | |||||||
| annual changes | % | 1 | 0 | 0 | |||||||
| packaging waste | index (2001=100) | 132 | 128 | 127 | |||||||
| GDP | index (2001=100) | 127 | 124 | 122 |
Analysis of annual reports on waste management in 2008; Waste Management Database, Environmental Agency of the Republic of Slovenia, 2010
| 2004 - generated | 2004 - recycled | 2005 - generated | 2005 - recycled | 2006 - generated | 2006 - recycled | 2007 - generated | 2007 - recycled | 2008 - generated | 2008 - recycled | ||
|---|---|---|---|---|---|---|---|---|---|---|---|
| paper and cardboard | t | 52202 | 39790 | 56030 | 43316 | 70416 | 46699 | 76268 | 52222 | 80331 | 53291 |
| wood | t | 28520 | 1313 | 31590 | 6478 | 36182 | 1890 | 38241 | 8043 | 35717 | 2275 |
| plastics | t | 32345 | 6115 | 33940 | 11506 | 47348 | 18299 | 45731 | 21248 | 47890 | 20214 |
| glass | t | 26228 | 4694 | 25650 | 10405 | 31259 | 11902 | 32292 | 13514 | 31373 | 23714 |
| metals | t | 13798 | 3315 | 13120 | 4633 | 18077 | 3443 | 18187 | 3803 | 18476 | 3658 |
| other | t | 8414 | 197 | 8300 | 66 | 899 | 79 | 1365 | 700 | 1323 | 1283 |
| total | t | 161507 | 55424 | 168630 | 76404 | 204181 | 82312 | 212085 | 99530 | 215110 | 104436 |
| 2009 - generated | 2009 - recycled | 2010 - generated | 2010 - recycled | 2011 - generated | 2011 - recycled | 2012 - generated | 2012 - recycled | 2013 - generated | 2013 - recycled | ||
| paper and cardboard | t | 82312 | 59451 | 80904 | 60395 | 82226 | 60458 | 79305 | 62382 | 79125 | 62241 |
| wood | t | 28912 | 3177 | 29813 | 4694 | 32843 | 5117 | 28688 | 9484 | 28909 | 4355 |
| plastics | t | 46603 | 19586 | 45268 | 30477 | 44729 | 33791 | 44841 | 29063 | 42050 | 34364 |
| glass | t | 31627 | 16575 | 31347 | 23546 | 31146 | 25632 | 31993 | 27928 | 32982 | 28319 |
| metals | t | 15988 | 4295 | 14966 | 4921 | 15043 | 6075 | 15225 | 6336 | 15260 | 8912 |
| other | t | 1552 | 2297 | 1465 | 171 | 1409 | 876 | 1969 | 37 | 2070 | 18 |
| total | t | 206994 | 105381 | 203763 | 124204 | 207396 | 131949 | 202021 | 135230 | 200396 | 138209 |
Analysis of annual reports on waste management in 2008; Waste Management Database, Environmental Agency of the Republic of Slovenia, 2010
| 2001 | 2002 | 2003 | 2004 | 2005 | 2006 | 2007 | 2008 | 2009 | 2010 | ||
|---|---|---|---|---|---|---|---|---|---|---|---|
| paper and cardboard | % | np | np | np | 77 | 77 | 66 | 74 | 66 | 72 | 75 |
| plastics | % | 10 | 14 | 8 | 26 | 34 | 39 | 51 | 43 | 42 | 71 |
| glass | % | np | np | np | 18 | 41 | 38 | 42 | 76 | 52 | 75 |
| wood | % | np | np | np | 47 | 31 | 39 | 36 | 38 | 37 | 41 |
| metals | % | np | np | np | 24 | 35 | 19 | 21 | 20 | 27 | 33 |
| others | % | np | np | np | np | np | np | np | np | 0 | 16 |
| total (all packaging waste) | % | 8 | 12 | 13 | 43 | 47 | 46 | 53 | 54 | 53 | 66 |
| 2011 | 2012 | 2013 | |||||||||
| paper and cardboard | % | 77 | 81 | 82 | |||||||
| plastics | % | 82 | 97 | 128 | |||||||
| glass | % | 82 | 87 | 86 | |||||||
| wood | % | 41 | 55 | 48 | |||||||
| metals | % | 40 | 42 | 58 | |||||||
| others | % | 83 | 8 | ||||||||
| total (all packaging waste) | % | 70 | 78 | 93 |
Analysis of annual reports on waste management in 2008; Waste Management Database, Environmental Agency of the Republic of Slovenia, 2010
| 2004 | 2005 | 2006 | 2007 | 2008 | 2009 | 2010 | 2011 | 2012 | 2013 | ||
|---|---|---|---|---|---|---|---|---|---|---|---|
| paper and cardboard | % | 76 | 77 | 66 | 68 | 66 | 72 | 75 | 74 | 79 | 79 |
| wood | % | 5 | 21 | 5 | 21 | 6 | 11 | 16 | 16 | 33 | 15 |
| plastics | % | 19 | 34 | 39 | 46 | 42 | 42 | 67 | 76 | 65 | 82 |
| glas | % | 18 | 41 | 38 | 42 | 76 | 52 | 75 | 82 | 87 | 86 |
| metals | % | 24 | 35 | 19 | 21 | 20 | 27 | 33 | 40 | 42 | 58 |
| other | % | 2 | 1 | 9 | 51 | 97 | 148 | 12 | 62 | 2 | 1 |
| total (all packaging waste) | % | 34 | 45 | 40 | 47 | 49 | 51 | 61 | 64 | 67 | 69 |
Waste Management Database, Environmental Agency of the Republic of Slovenia, 2010; Eurostat, Packaging waste, 2010
Goals
· Recovery, including energy recovery: at least 50% of the total mass of packaging waste;
· Recycling: at least 55% and no more than 80% of the total mass of packaging waste
· Recycling of individual types of packaging material contained in the total mass of packaging waste: glass 60%, paper and cardboard 60%, metals 50%, plastic 22.5% and wood 15%.
Comment
The quantity of generated packaging depends both on consumers' behaviour as well as production and distribution patterns. Packaging waste is generated in households and in manufacturing and service activities. Consumers can contribute greatly to the reduction in quantities of packaging.
Management of packaging waste holds a special position in waste management, not just because of generated quantities and risk potential, but rather because of the enormous volume of packaging waste and extremely widespread generation of packaging waste in our everyday life.
In recent years, the quantity of generated packaging waste has stabilised at approximately 100 kg per capita. In 2014, 209,704 tonnes of packaging waste, i.e. 102 kg of packaging waste per capita, was generated. The structure of packaging waste was as follows: glass 15% (32,478 tonnes), plastic 21% (44,214 tonnes), paper and board 40% (84,730 tonnes), metals 8% (17,032 tonnes), wood 14% (29,400 tonnes) and other 1% (1,850 tonnes).
The quantities of generated packaging waste were increasing up to and including 2008. In 2009, quantities dropped, one reason being the economic crisis. In the years following 2014, the GDP also declined compared to previous years. In 2014, 3.7% more packaging waste per unit of GDP was generated compared to 2001.
In 2014, packaging waste was managed by six companies, GORENJE SUROVINA, INTERSEROH, RECIKEL, SLOPAK EMBAKOM and UNIREC. Packaging waste management companies must provide regular collection of packaging waste that is categorised as municipal waste in collection centres or centres for municipal waste treatment operated by public utility service providers. These companies also provide treatment of non-municipal packaging waste collected from companies or other legal entities included in their packaging waste collection and treatment schemes.
In some cases, the data for 2014 (plastic and other packaging materials) shows that the quantity of recovered waste exceeded the quantity of waste generated in that year. In 2014, 99% of waste glass packaging, 82% of waste paper and cardboard packaging, 64% of waste wood packaging and 51% of waste metal packaging was recovered. Together, 88% of the total mass of packaging waste was recovered in 2014.
The highest recycling rate was achieved in waste glass packaging (99%), followed by paper and cardboard (80%), plastic (69%), metal (51%) and wood (26%) packaging waste. The recycling objectives were achieved for all packaging materials. With 69% of the total mass of packaging waste recycled, the objective of 55% was also achieved.
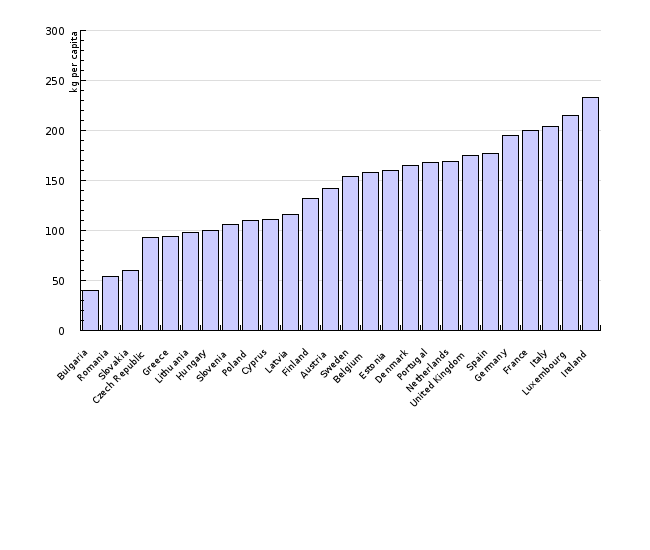
In the European Union, the quantities of generated packaging waste per capita has stabilised at approximately 160 kg per capita. However, significant differences have been observed between individual countries. In 2013, 46.7 kg of packaging waste per capita was generated in Croatia, while in Germany the quantity for the same year was 210.4 kg per capita. As regards packaging materials, the highest share in the EU-28 was held by waste paper and cardboard, followed by glass, plastic, wood and metals. Other packaging materials represented less than 3% of the total volume of generated packaging waste.
Most of the countries that were obliged to achieve a minimum recycling rate by 2008 succeeded to do so, including Slovenia.
In European countries, recovery represents 38–98% of the total packaging generated. The lowest percentage of generated packaging is recovered in Poland and the highest in Germany. In European countries, the largest share of packaging waste recovery is represented by recycling, followed by incineration and incineration for the purposes of energy generation. Other forms of recovery represent only a small percentage. Countries where waste incineration for the purposes of energy generation represents a high percentage of waste recovery are also characterised by high packaging waste recovery rates. In particular, these are Scandinavian countries, Belgium, the Netherlands, Ireland, Austria and Luxembourg. In 2013, the percentage of waste incinerated for the purposes of energy generation exceeded 10%.
In order to meet the objectives of the Packaging and Packaging Waste Directive, most Member States imposed the Producer Responsibility Principle and introduced special systems of packaging waste collection and further treatment. In addition, some countries introduced economic instruments (taxes and other duties) and improved the infrastructure for collection and treatment of packaging waste.


