[OD13] Packaging waste 

Definition
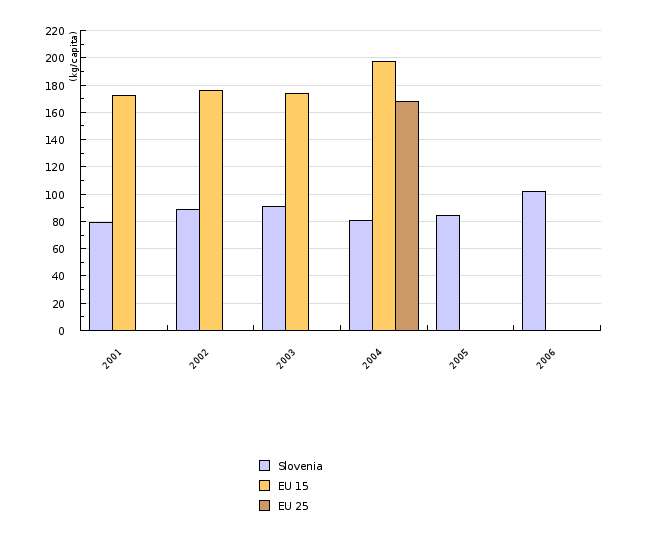
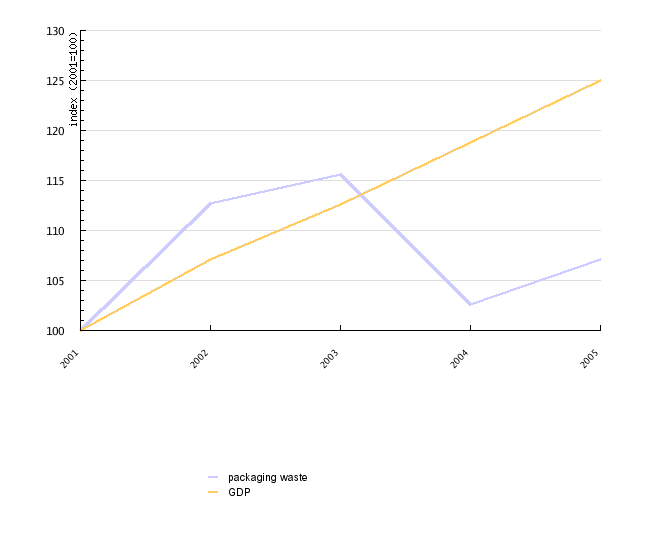
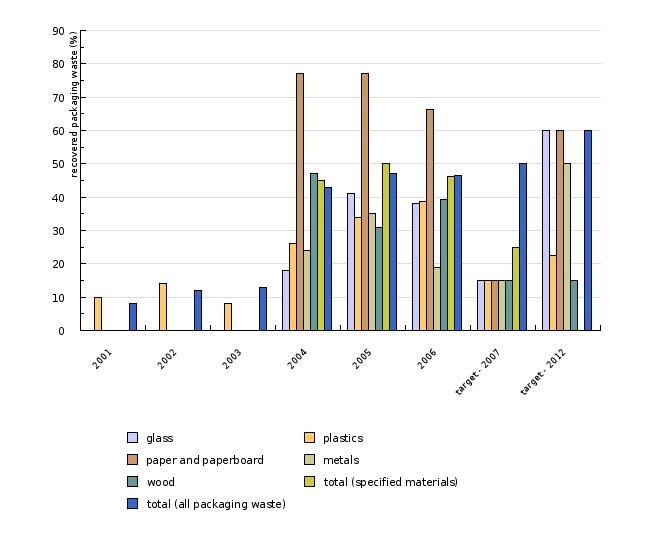
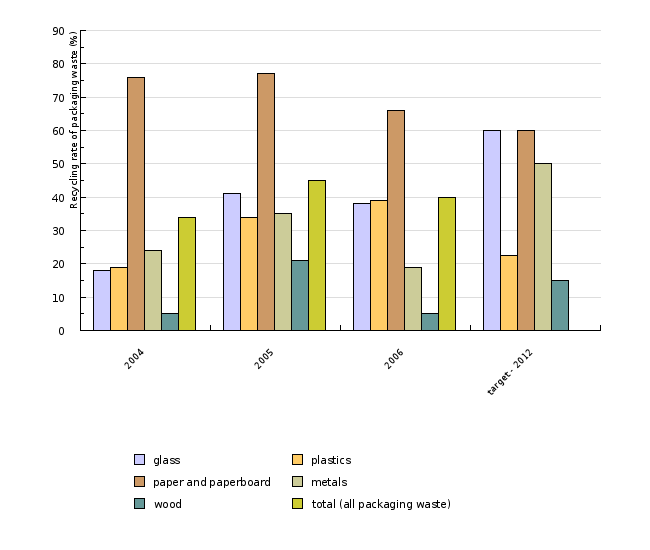
The indicator shows the quantity of packaging waste generated per capita, decoupling of the quantity of produced packaging from the GDP, the quantity of produced and recovered packaging waste by material and the shares of recovered and recycled packaging waste relative to the set objectives.
Packaging is defined as products made of any type of material intended to cover or hold goods (raw materials or final products) for the purpose of storage or protection, handling, delivery or presentation on the route from the packaging facility to the end user (Decree on the management of packaging and packaging waste, Official Gazette of the RS, nos. 84/2006, 106/06 and 110/2007). In addition, all products and items listed in Article 3 of this Decree also constitute packaging.
Charts
Analysis of annual reports on waste management in 2005; Waste Management Database, Environmental Agency of the Republic of Slovenia, 2008
| 2001 | 2002 | 2003 | 2004 | 2005 | 2006 | ||
|---|---|---|---|---|---|---|---|
| Slovenia | kg per capita | 79 | 89 | 91 | 81 | 84 | 102 |
| EU 15 | kg per capita | 172 | 176 | 174 | 197 | ||
| EU 25 | kg per capita | 168 |
Analysis of annual reports on waste management in 2005; Waste Management Database, Environmental Agency of the Republic of Slovenia, 2006
| 2001 | 2002 | 2003 | 2004 | 2005 | ||
|---|---|---|---|---|---|---|
| packaging waste | t | 157481 | 177547 | 182000 | 161507 | 168630 |
| GDP | mio EUR | 22099 | 23673 | 24876 | 26257 | 27626 |
| packaging waste | index (2001=100) | 100 | 113 | 116 | 103 | 107 |
| GDP | index (2001=100) | 100 | 107 | 113 | 119 | 125 |
Analysis of annual reports on waste management in 2005; Waste Management Database, Environmental Agency of the Republic of Slovenia, 2008
| 2001 - produced | 2001 - recovered | 2002 - produced | 2002 - recovered | 2003 - produced | 2003 - recovered | 2004 - produced | 2004 - recovered | 2005 - produced | 2005 - recovered | ||
|---|---|---|---|---|---|---|---|---|---|---|---|
| glass | t | 24118 | np | 21842 | np | 22823 | np | 26228 | 4694 | 25650 | 10405 |
| plastics | t | 29883 | 3026 | 31463 | 4529 | 32598 | 2517 | 32345 | 8305 | 33940 | 11507 |
| paper and paperboard | t | 45891 | np | 57575 | np | 52120 | np | 52202 | 39880 | 56030 | 43339 |
| metals | t | 13329 | np | 13769 | np | 14506 | np | 13798 | 3315 | 13120 | 4633 |
| wood | t | 36510 | np | 44972 | np | 34393 | np | 28520 | 13416 | 31590 | 9728 |
| other | t | 385 | np | 642 | np | 864 | np | 8414 | 214 | 8300 | 66 |
| total | t | 157480 | 12252 | 177547 | 21396 | 164390 | 21445 | 161507 | 69824 | 168630 | 79678 |
| 2006 - produced | 2006 - recovered | ||||||||||
| glass | t | 31259 | 11902 | ||||||||
| plastics | t | 47348 | 18304 | ||||||||
| paper and paperboard | t | 70416 | 46760 | ||||||||
| metals | t | 18077 | 3443 | ||||||||
| wood | t | 36182 | 14204 | ||||||||
| other | t | 899 | 79 | ||||||||
| total | t | 204181 | 94692 |
Analysis of annual reports on waste management in 2005; Waste Management Database, Environmental Agency of the Republic of Slovenia, 2008
| 2001 | 2002 | 2003 | 2004 | 2005 | 2006 | target - 2007 | target - 2012 | ||
|---|---|---|---|---|---|---|---|---|---|
| glass | % | np | np | np | 18 | 41 | 38.1 | 15 | 60 |
| plastics | % | 10 | 14 | 8 | 26 | 34 | 38.7 | 15 | 22.5 |
| paper and paperboard | % | np | np | np | 77 | 77 | 66.4 | 15 | 60 |
| metals | % | np | np | np | 24 | 35 | 19 | 15 | 50 |
| wood | % | np | np | np | 47 | 31 | 39.3 | 15 | 15 |
| total (specified materials) | % | np | np | np | 45 | 50 | 46.3 | 25 | np |
| total (all packaging waste) | % | 8 | 12 | 13 | 43 | 47 | 46.4 | 50 | 60 |
Analysis of annual reports on waste management in 2005; Waste Management Database, Environmental Agency of the Republic of Slovenia, 2008.
| 2004 | 2005 | 2006 | target - 2012 | ||
|---|---|---|---|---|---|
| glass | % | 18 | 41 | 38 | 60 |
| plastics | % | 19 | 34 | 39 | 22.5 |
| paper and paperboard | % | 76 | 77 | 66 | 60 |
| metals | % | 24 | 35 | 19 | 50 |
| wood | % | 5 | 21 | 5 | 15 |
| other | % | 2 | 1 | 9 | np |
| total (all packaging waste) | % | 34 | 45 | 40 | 55-80 |
Goals
- to ensure the recovery of packaging waste, including energy recovery, for a minimum of 60 % of the total weight of packaging waste; to recycle between 55 % and 80 % of the total weight of packaging waste; to ensure the following recycling shares for individual types of packaging materials included in the total weight of packaging waste: 60 % of weight for glass, 60 % of weight for paper and cardboard,
50 % of weight for metals, 22.5 % of weight for plastic (only material which is recycled back into plastic is included), 15 % of weight for wood (Decree on the management of packaging and packaging waste, 2006).
- to recover 50 % of the total weight of packaging waste by the end of 2007, 25 % of which should be the total weight of the following materials: paper and cardboard, plastic, wood, metal, glass, while recovering 15 % of the weight of each individual material; to recover 60 % of the total weight by the end of 2012; to recycle 55 – 80 % of the weight, including 60 % of glass, 60 % of paper and cardboard,
50 % of metals, 22.5 % of plastic (only material which is recycled back into plastic is included) and 15 % of wood (Resolution on National Environmental Action Plan 2005-2012).
Comment
Annual quantities of packaging waste amount to 16-20,000 tonnes. In 2005, Slovenia generated 204,181 tonnes of packaging waste, i.e. 102 kg per capita. Waste packaging includes all packaging entering the Slovenian market along with goods, service packaging and disposable packaging entering the Slovenian market as well as packaging imported by end users. It is stipulated that all the packaging entering the market becomes packaging waste in the same year. In 2006, we produced 70,416 tonnes of paper and cardboard, 47,348 tonnes of plastic, 36,182 tonnes of wood, 31,259 tonnes of glass, 18,077 tonnes of metals and 899 tonnes of other packaging material.
Up to 2003, the quantities of waste packaging rose parallel to the GDP; from 2003 onwards, however, Slovenia has been inching closer to the desired decoupling of packaging waste growth from GDP growth.
In 2006, packaging waste was managed by two companies, SLOPAK and INTERSEROH. The companies collected approximately 160,000 tonnes of packaging waste from households, production and service activities. In accordance with the 2001 Order on the management of separately collected fractions in the public service of urban waste management, collection centres have been gradually set up for household packaging waste based on the number of inhabitants in each municipality. Household packaging waste is collected by a local public service responsible for municipal waste and transported to the waste management company, where it is further handled as necessary.
In 2006, 46 % of the total weight of packaging waste was recovered, thus approaching the objective for 2007 which anticipated 50 % recovery. Paper, cardboard, plastic, wood, metals and glass reached 46% recovery, thereby exceeding the 2007 objective of 25 % recovery. In addition, objectives set for 2007 were exceeded for individual materials such as plastic, paper and cardboard, metals, glass and wood.
Recycling was carried out for 40 % of packaging waste in 2006, nearing the 2012 objective of 55-80 % recycling. Objectives for individual materials were exceeded in plastic as well as paper and cardboard.
39 % of plastic and 66 % of paper and cardboard was recycled. Glass recycling amounted to 38% (the 2012 objective is set at 60 %), metals to 19 % (2012 objective: 50 %) and wood to 15 % (2012 objective: 15 %).
According to an assessment by the European Environment Agency published in 2008, EU countries have noted an increase in the quantities of packaging entering the market. The increase breaches the Directive on packaging and packaging waste, which defines the reduction of packaging waste as one of its objectives. However, we have achieved and exceeded the objective of 25 % recycling of packaging waste by 2001. Furthermore, we are successfully approaching the 55 % objective for 2008, as in 2004 we recycled 54 % of all packaging waste. In 2004, 25 EU countries produced on average 168 kg of packaging waste per capita, while the collected quantities vary significantly, ranging between 69 kg per capita in Lithuania and Slovakia, 205 kg per capita in Ireland and 209 per capita in Italy. The discrepancy may be attributed to the differences in methodology.
Methodology
Analysis of annual reports on waste management in 2005; Waste Management Database, Environmental Agency of the Republic of Slovenia, 2008.
List of used sources
EEA, 2008; Generation and recycling of packaging waste (CSI 017)


