[PR23] Daily Passenger Mobility

Key message

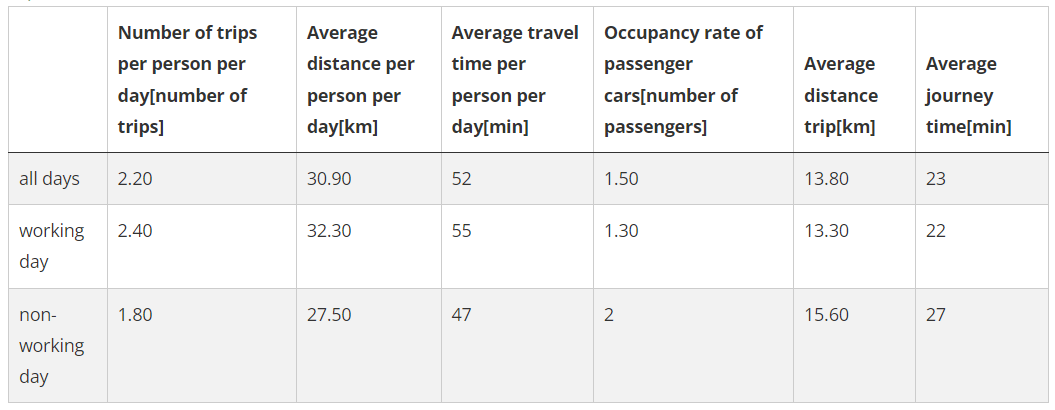
The daily mobility of the population is a fundamental indicator of the performance and development trends of the transport system, and it also indirectly reflects the impact of the transport system on the environment - the greater the use of sustainable travel modes, the lower the impact of the transport system on the environment. In 2021, a resident of Slovenia made an average of 2.2 trips per day, the length of the trip was 31 km on average (27 km in the EU) and it took approximately 52 minutes (80 minutes in the EU). In Slovenia more than two-thirds of the trips (67%) were made by car, and only 3% utilizing public transport. This places Slovenia in a negative deviation from the EU average, where 54% of journeys are made by car, and 6% by public transport. Furthermore, in Slovenia, 85% of all trip distances were covered by car, while only 5% were covered by public transport. Public transport is the primary mode of transportation solely for educational purposes; for all other purposes, the use of cars predominates. On 70% of car journeys, only the driver was present, resulting in an average car occupancy rate of 1.5 people.
Charts
Statistical Office of RS, Daily passenger mobility, 2023
Statistical Office of RS, Daily passenger mobility (2023)
| Car[%] | Walking, running[%] | Cycling[%] | Public transport[%] | Other means of transport[%] | |
|---|---|---|---|---|---|
| Slovenia | 67 | 21 | 5 | 3 | 3 |
DG MOVE, European Passenger Mobility Survey (2023)
| Car[%] | Walking[%] | Cycling[%] | Public transport[%] | Other[%] | Motorcycle/moped[%] | |
|---|---|---|---|---|---|---|
| EU | 54 | 27 | 8 | 6 | 4 | 2 |
Statistical Office of RS, Daily passenger mobility (2023)
| Other means of transport[Number of trips] | Walking[Number of trips] | Bicycle[Number of trips] | Public transport[Number of trips] | Car[Number of trips] | |
|---|---|---|---|---|---|
| 0,1-0,9 km | 8082 | 316239 | 32041 | 0 | 84344 |
| 1,0-2,4 km | 24184 | 239563 | 58851 | 4180 | 331025 |
| 2,5-4,9 km | 17986 | 149393 | 47520 | 12786 | 383018 |
| 5,0 - 9,9 km | 6606 | 90028 | 30620 | 20825 | 570362 |
| 10,0 - 19,9 km | 14127 | 13631 | 16964 | 24348 | 539143 |
| 20,0 - 300,0 km | 11728 | 0 | 16938 | 41077 | 662175 |
Statistical Office of RS, Daily passenger mobility (2023)
| Other means of transport [Number of trips] | Walking [Number of trips] | Bicycle [Number of trips] | public transport [Number of trips] | Car [Number of trips] | |
|---|---|---|---|---|---|
| 15-25 years | 12967 | 89152 | 25510 | 60684 | 244116 |
| 26-40 years | 22660 | 174546 | 46910 | 9804 | 719881 |
| 41-55 years | 41691 | 202182 | 57522 | 16024 | 875667 |
| 56-70 years | 26264 | 231033 | 57104 | 13859 | 562286 |
| 71-84 years | 4674 | 112484 | 16903 | 5357 | 168118 |
Methodology
- EC, 2001. White Paper, European transport policy for 2010: time to decide.
- EC, 2008. Sustainable Consumption and Production and Sustainable Industrial Policy Action Plan.
- EC, 2016. The Roadmap to a Resource Efficient Europe.
- EC, 2020a. General Union Environment Action Programme to 2030 (8th EAP). Proposal.
- EC, 2020b. Sustainable and Smart Mobility Strategy – putting European transport on track for the future.


