[ZR01] Emissions of sulphur dioxide 

Definition
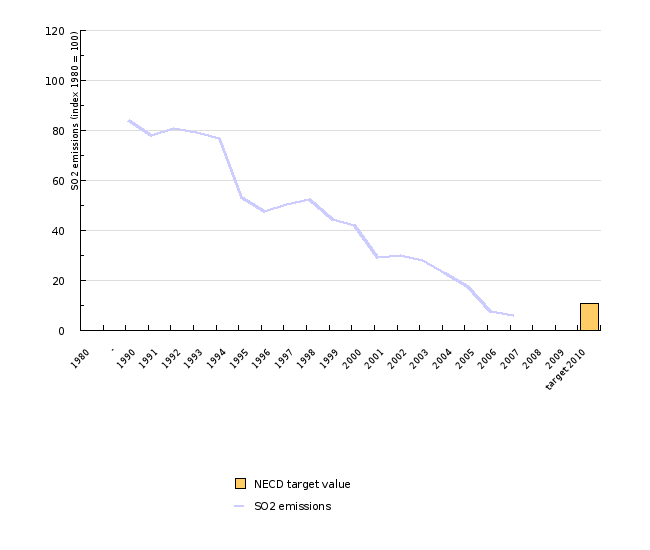
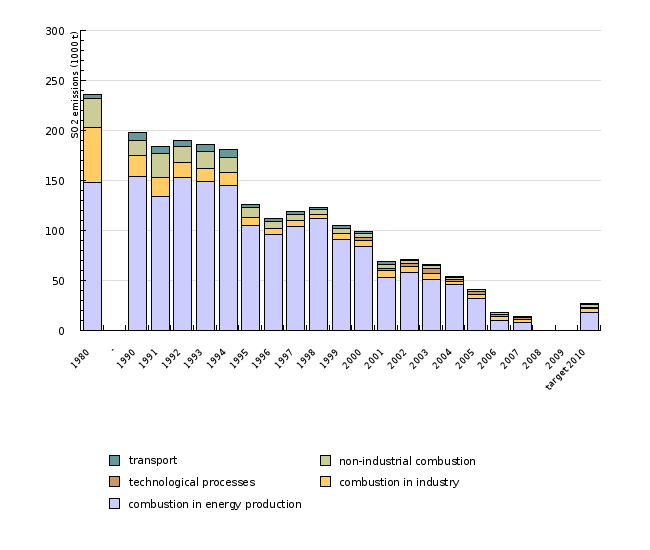
The indicator shows the trend in quantities of total sulphur dioxide (SO2) emissions in Slovenia and main source categories. The quantities of emissions are calculated in accordance with the methodology for creating the National Emission Inventory, based on the CORINAIR methodology. The emissions are shown in a time series from 1990 to 2002.
Charts
National Emission Inventory, Environmental Agency of the Republic of Slovenia, 2008
| 1980 | - | 1990 | 1991 | 1992 | 1993 | 1994 | 1995 | 1996 | 1997 | ||
|---|---|---|---|---|---|---|---|---|---|---|---|
| SO2 emissions | 1000 t | 235.795 | 198 | 184.012 | 190.293 | 186.45 | 181.037 | 125.63 | 112.296 | 118.799 | |
| SO2 emissions | index (1980 = 100) | 100 | 83.9712462096 | 78.038974533 | 80.7027290655 | 79.0729235141 | 76.7772853538 | 53.2793316228 | 47.624419517 | 50.3823236286 | |
| NECD target value | index (1980 = 100) | ||||||||||
| 1998 | 1999 | 2000 | 2001 | 2002 | 2003 | 2004 | 2005 | 2006 | 2007 | ||
| SO2 emissions | 1000 t | 123.255 | 104.506 | 99.336 | 68.699 | 70.994 | 65.608 | 54.142 | 41.215 | 17.925 | 14.245 |
| SO2 emissions | index (1980 = 100) | 52.2721007655 | 44.320702305 | 42.1281197651 | 29.1350537543 | 30.1083568354 | 27.8241692996 | 22.9614707691 | 17.4791662249 | 7.60194236519 | 6.04126465786 |
| NECD target value | index (1980 = 100) | ||||||||||
| 2008 | 2009 | target 2010 | |||||||||
| SO2 emissions | 1000 t | 27 | |||||||||
| SO2 emissions | index (1980 = 100) | ||||||||||
| NECD target value | index (1980 = 100) | 11 |
National Emission Inventory, Environmental Agency of the Republic of Slovenia, 2008
| 1980 | - | 1990 | 1991 | 1992 | 1993 | 1994 | 1995 | 1996 | 1997 | ||
|---|---|---|---|---|---|---|---|---|---|---|---|
| combustion in energy production | 1000 t | 148.394 | 153.722 | 134.017 | 152.826 | 148.559 | 145.094 | 105.053 | 96.453 | 104.245 | |
| combustion in industry | 1000 t | 54.718 | 21.046 | 18.775 | 14.726 | 13.116 | 12.883 | 8.276 | 5.78 | 6.01 | |
| technological processes | 1000 t | ||||||||||
| non-industrial combustion | 1000 t | 28.502 | 15.521 | 24.093 | 16.031 | 17.539 | 15.13 | 9.276 | 7.068 | 5.436 | |
| transport | 1000 t | 4.181 | 7.711 | 7.127 | 6.71 | 7.236 | 7.93 | 3.025 | 2.995 | 3.108 | |
| 1998 | 1999 | 2000 | 2001 | 2002 | 2003 | 2004 | 2005 | 2006 | 2007 | ||
| combustion in energy production | 1000 t | 111.906 | 90.538 | 83.78 | 53.118 | 57.607 | 51.1 | 45.501 | 32.452 | 9.696 | 8.351 |
| combustion in industry | 1000 t | 4.054 | 6.652 | 6.415 | 6.771 | 6.456 | 6.237 | 3.269 | 3.679 | 3.908 | 3.012 |
| technological processes | 1000 t | 2.418 | 2.382 | 2.802 | 4.323 | 1.983 | 2.399 | 2.055 | 1.186 | ||
| non-industrial combustion | 1000 t | 4.55 | 4.764 | 4.025 | 3.808 | 3.515 | 3.293 | 2.669 | 2.464 | 2.013 | 1.441 |
| transport | 1000 t | 2.745 | 2.552 | 2.698 | 2.62 | 0.614 | 0.655 | 0.72 | 0.221 | 0.253 | 0.255 |
| 2008 | 2009 | target 2010 | |||||||||
| combustion in energy production | 1000 t | 18 | |||||||||
| combustion in industry | 1000 t | 4.5 | |||||||||
| technological processes | 1000 t | 0.5 | |||||||||
| non-industrial combustion | 1000 t | 3.5 | |||||||||
| transport | 1000 t | 0.5 |
Goals
The target is to reduce SO2 emissions to the target value 27 000, as required by the Protocol on the Reduction of Acidification, Eutrophication and Ground Ozone, and Directive 2001/81/EC on National Emissions Ceilings for Certain Atmospheric Pollutants (NECD). Air emission management and reduction is also a target of the National Environmental Action Programme.
Comment
SO2 emissions in Slovenia have dropped by 66 percentage points compared to the value in 1990. This reduction may be ascribed to the start-up of the desulphurisation unit on block 4 of the Šoštanj power plant as well as to the introduction of natural gas and liquid fuels with lower sulphur content.
Methodology
The data are taken from the National Emission Inventory database. The database maintained at the Environmental Agency of the Republic of Slovenia contains emission assessments that are made on the basis of statistical data (on sold fuels, industrial production, agricultural activities, etc.) by using emission factors.


