[KM26] Plant available phosphorus and potassium in agricultural topsoil

Key message

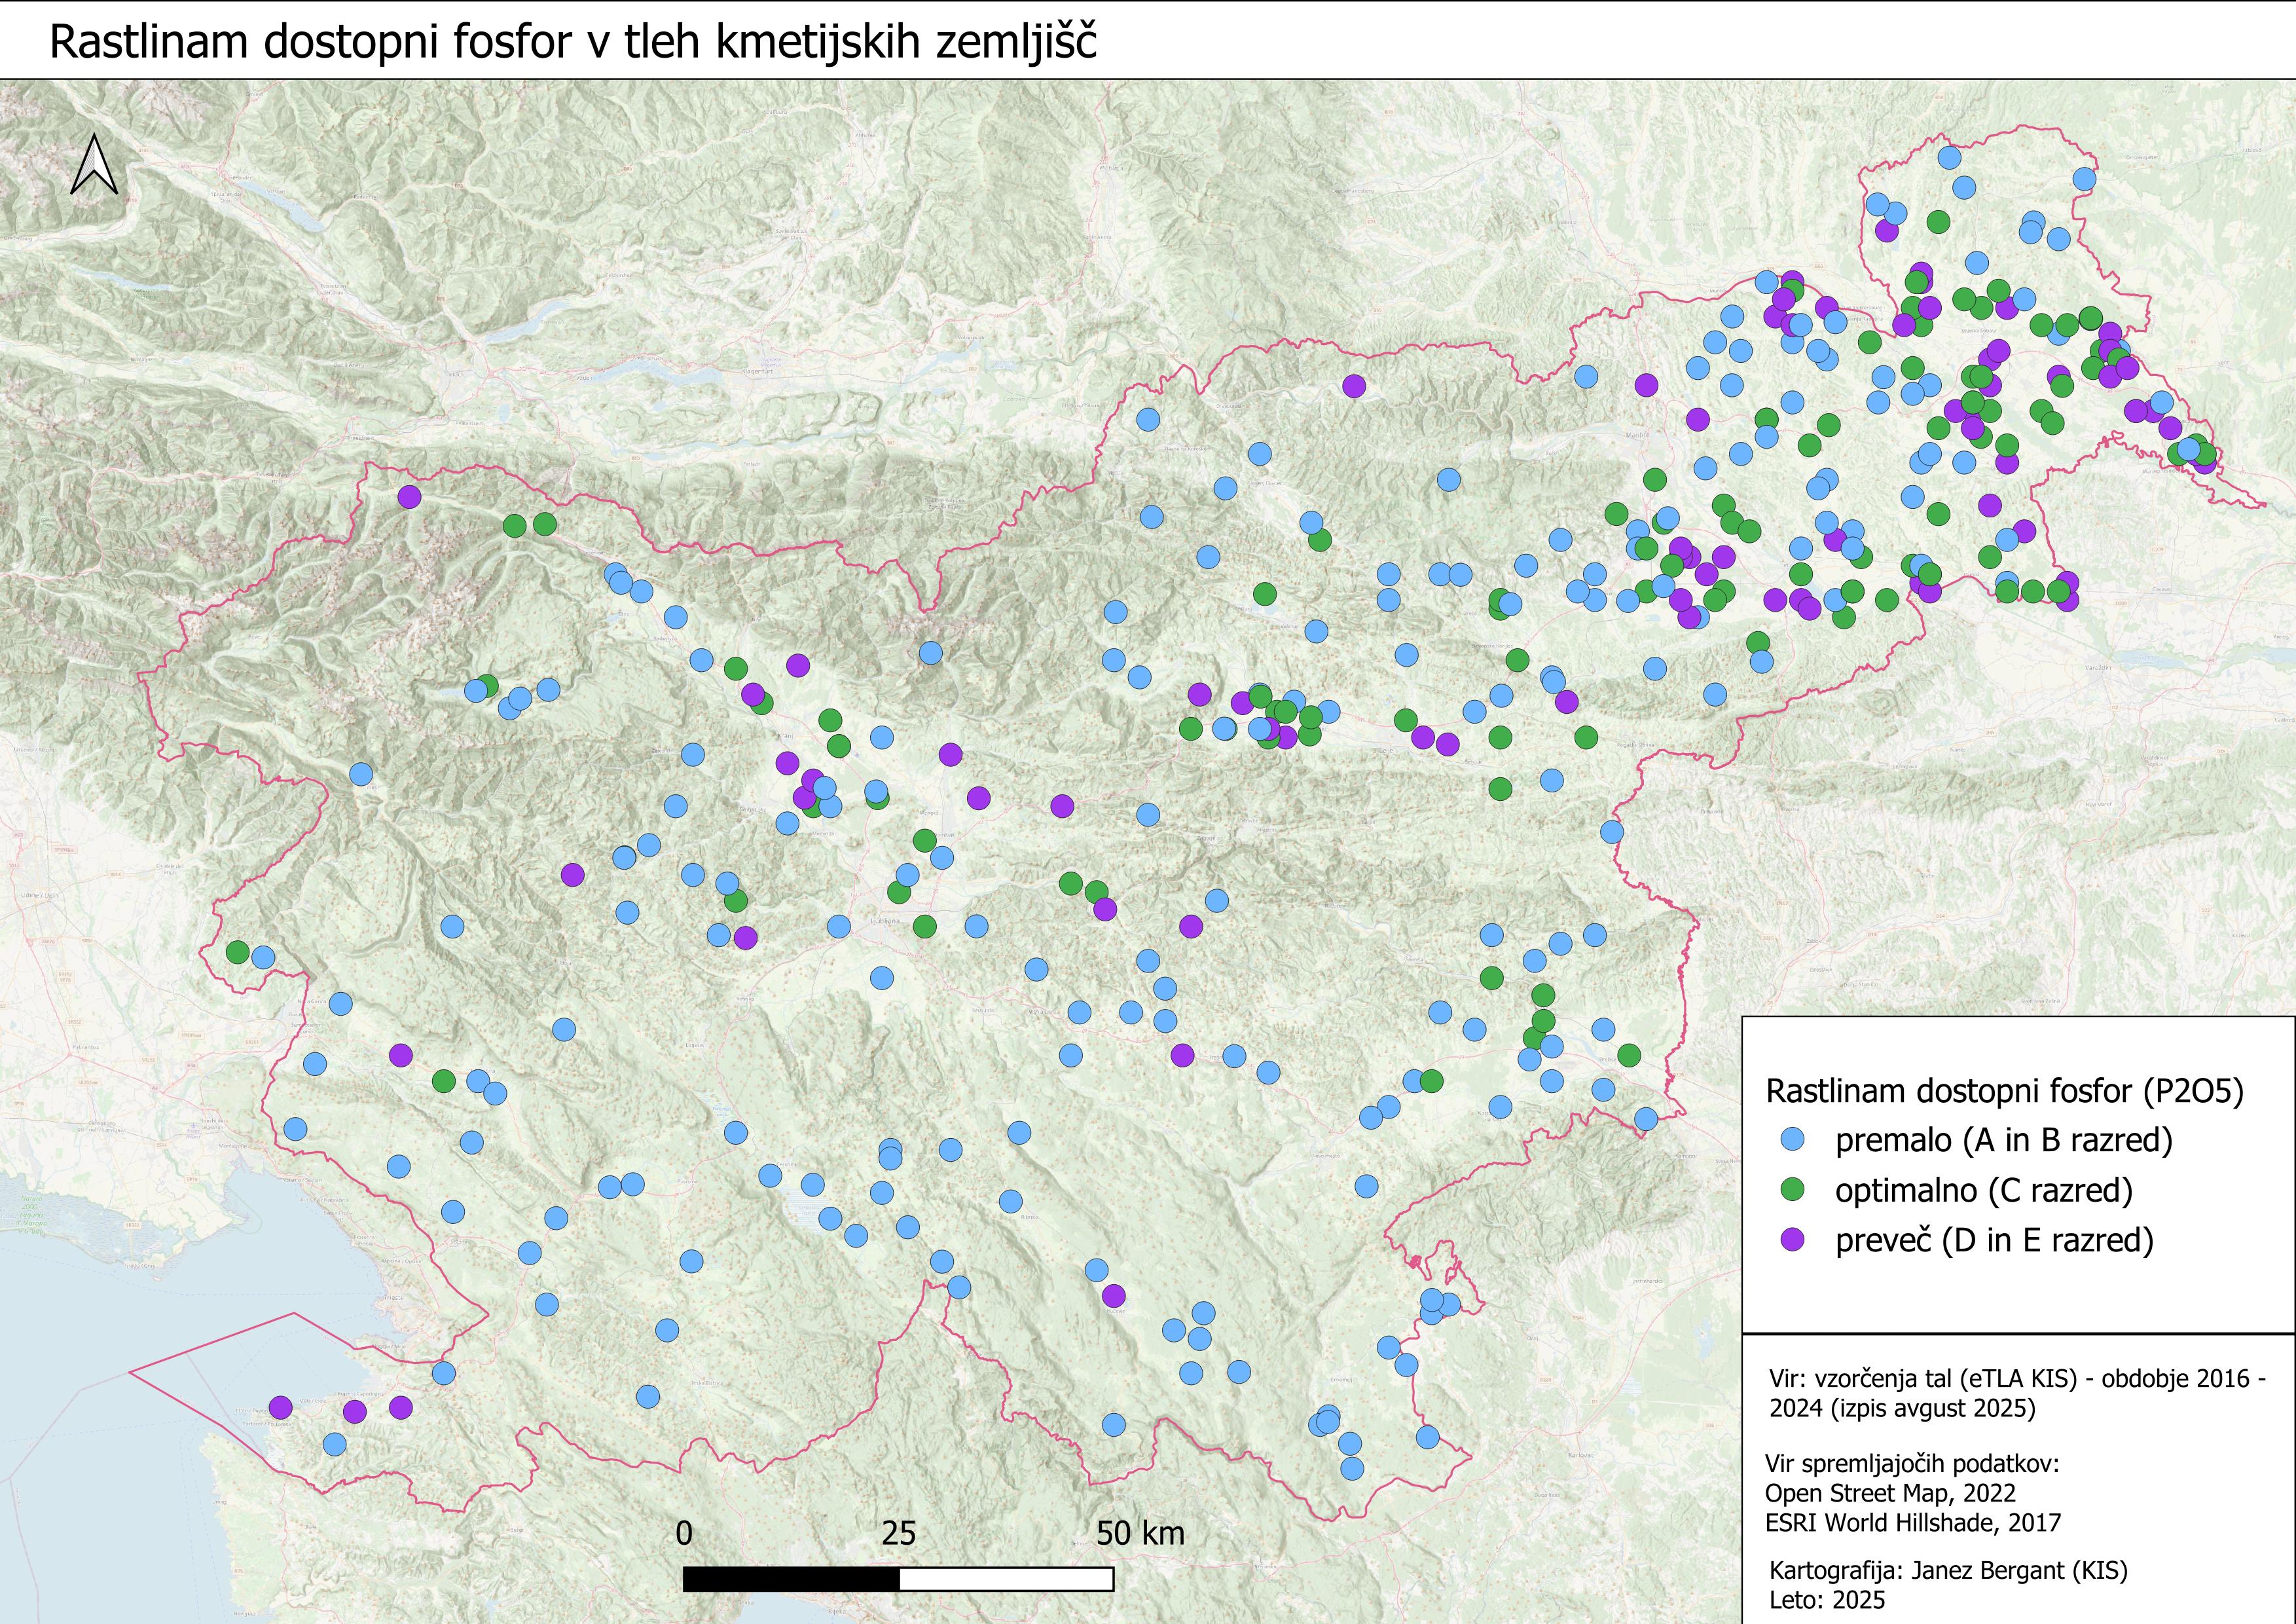
The analysis of soil fertility with plant-available phosphorus (P₂O₅) and potassium (K₂O) shows substantial differences among land-use types. On arable land, phosphorus supply is insufficient in 39% of samples, adequate in 34%, and excessive in 27%. In permanent crops, P₂O₅ levels are evenly distributed across all fertility classes, reflecting diverse management and fertilization practices. The most pronounced phosphorus deficiency is observed in permanent grasslands, where as much as 78% of soils have insufficient phosphorus content.
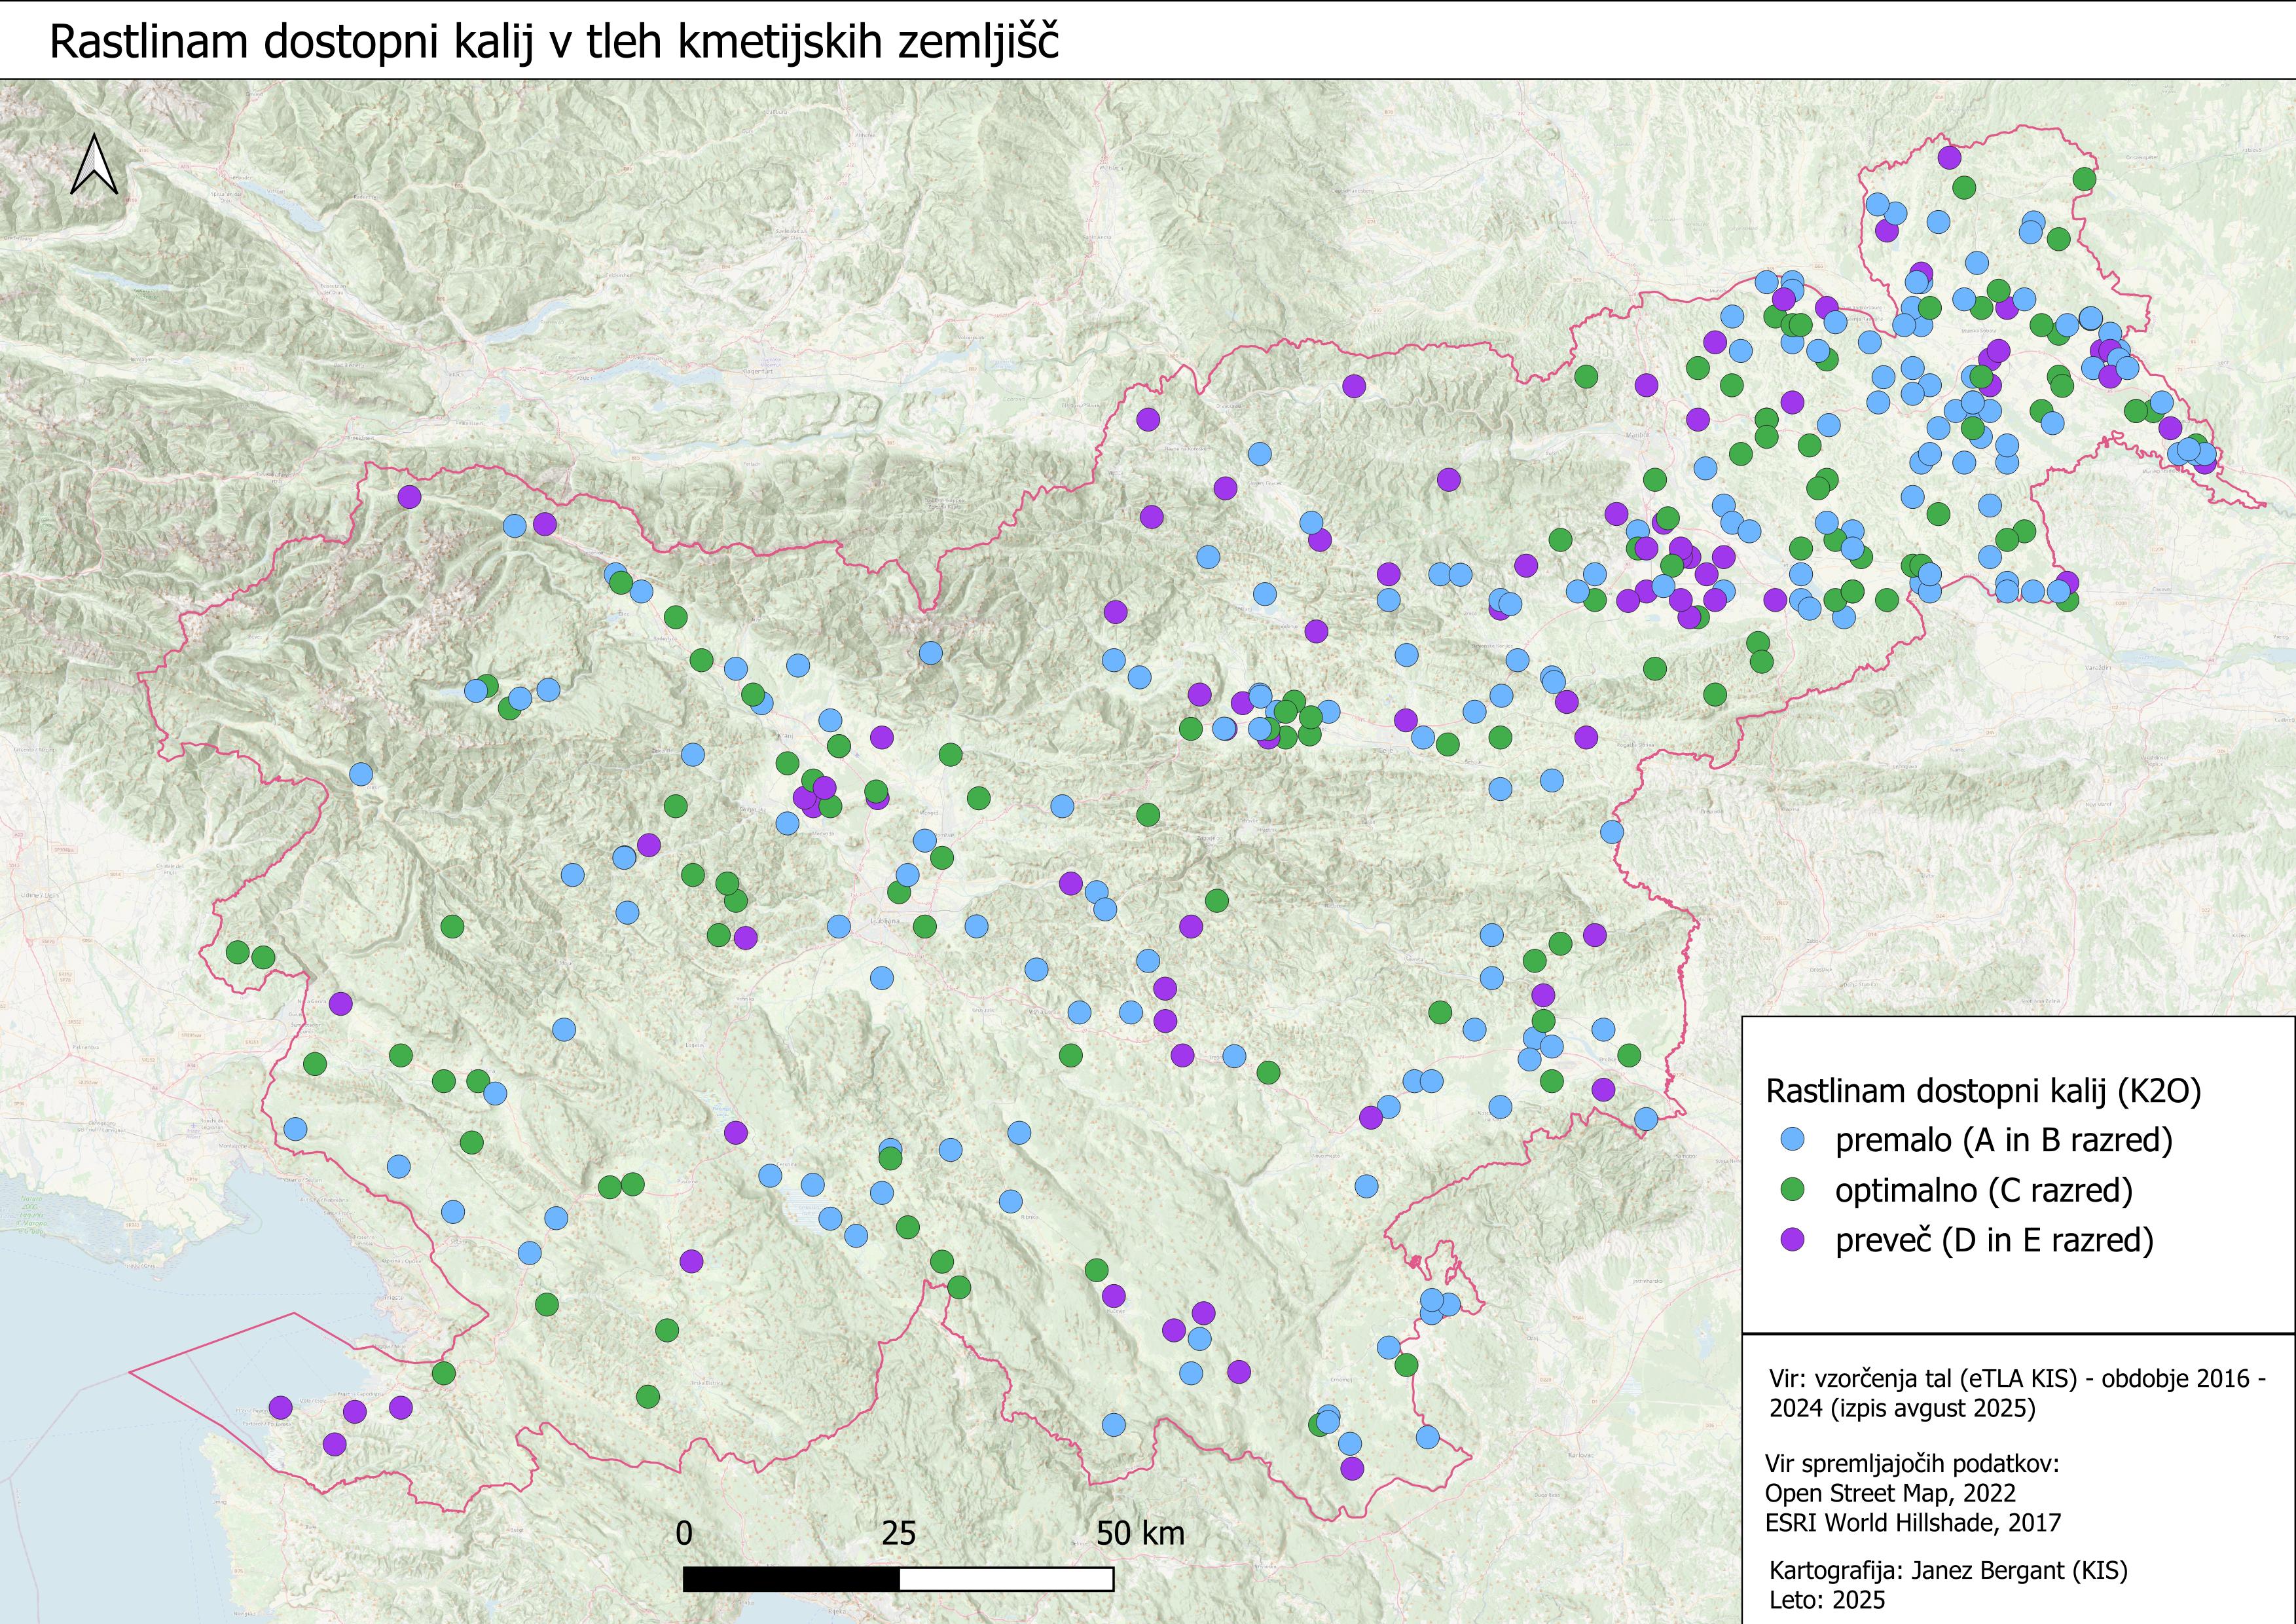
The analysis of plant-available potassium (K₂O) reveals that almost half of arable soils (46%) are potassium-deficient. In permanent crops, the situation is more favourable, as more than half of the soils are adequately supplied, although both deficiencies and surpluses occur. The largest K₂O deficit is again found in permanent grasslands, where 60% of soils have insufficient potassium levels.
A combined assessment of soil fertility with respect to phosphorus (P₂O₅) and potassium (K₂O) shows clear differences between land uses. Permanent grasslands are the least supplied with both nutrients, with half of the soils deficient in phosphorus and potassium simultaneously, while only 2% are adequately supplied.
Definition
The indicator shows the nutrient status of the topsoil with the two main plant nutrients: phosphorus (expressed as P₂O₅) and potassium (expressed as K₂O) for the following land-use categories: arable land, permanent grassland, and permanent crops.
The measurements of plant-available phosphorus and potassium were evaluated according to the Guidelines for Scientifically Based Fertilization (Mihelič et al., 2010). For the purpose of developing this indicator, the original five fertility classes were merged into three interpretative categories:
|
Grouping of fertility levels for the indicator (Mihelič et al., 2010) |
Interpretation of soil fertility indicator |
|
Poor and moderately supplied (Classes A + B) |
deficient |
|
Well supplied (Class C) |
well |
|
Excessively and extremely supplied (Classes D + E) |
excessive |
The values are shown as frequencies (in %) of soil fertility levels.
Charts
AIS (eTLA soil database; soil samples taken between 1.1.2016 in 31-12-2024)
| Percentage of soil samples based on classes of phosphorus content by land use[%] | Insufficient [%] | Adequate[%] | Excessive[%] | Total[%] | Insufficient [soil samples] | Adequate[soil samples] | Excessive[soil samples] | Total[soil samples] | |
|---|---|---|---|---|---|---|---|---|---|
| Arable | 39 | 34.20 | 26.70 | 100 | 73 | 64 | 50 | 187 | |
| Orchard | 33.30 | 33.30 | 33.30 | 100 | 16 | 16 | 16 | 48 | |
| Meadow | 78.40 | 13.60 | 8 | 100 | 98 | 17 | 10 | 125 |
AIS (eTLA soil database; soil samples taken between 1.1.2016 in 31-12-2024)
| Percentage of soil samples based on classes of potassium content by land use[%] | Insufficient [%] | Adequate[%] | Excessive[%] | Total[%] | Insufficient [soil samples] | Adequate[soil samples] | Excessive[soil samples] | Total[soil samples] | |
|---|---|---|---|---|---|---|---|---|---|
| Arable | 46 | 32.10 | 21.90 | 100 | 86 | 60 | 41 | 187 | |
| Orchard | 22.90 | 52.10 | 25 | 100 | 11 | 25 | 12 | 48 | |
| Meadow | 60 | 20.80 | 19.20 | 100 | 75 | 26 | 24 | 125 |
AIS (eTLA soil database; soil samples taken between 1.1.2016 in 31-12-2024)
| Percentage of soil samples based on classes of potassium and potassium content by land use[%] | Insufficient [%] | Adequate[%] | Excessive[%] | |
|---|---|---|---|---|
| Arable | 18.20 | 10.70 | 11.80 | |
| Orchard | 12.50 | 18.80 | 14.60 | |
| Meadow | 50.40 | 2.40 | 5.60 |
Goals
- Sustainable use and management of agricultural land - maintaining soil fertility while producing the necessary amounts of food and returning the nutrients to the soil by proper fertilizing.
Comment
Soil phosphorus (P₂O₅) status shows large differences among land uses. On arable land, the situation is relatively balanced: 39% of soils are phosphorus-deficient, 34% reach optimal values, and 27% are excessively supplied. This indicates that arable soils face both risks of deficiency, which can reduce yields, and risks of surplus, which increase the potential for runoff and water pollution. In permanent crops (orchards, vineyards), the picture is split into thirds – deficient, optimal, and excessive – reflecting the diversity of management practices. The most pronounced deficiency is observed in grasslands, where as much as 78% of soils are insufficiently supplied with phosphorus, 14% are optimal, and only 8% excessive. The phosphorus impoverishment of grasslands is linked to fertilization practices: mineral fertilizers are rarely applied, livestock manures contain relatively low levels of phosphorus, and continuous removal of biomass through mowing and grazing further depletes P. This can lead to reduced growth and lower forage quality. The results highlight the need for balanced, targeted fertilization adapted to land use.
Soil potassium (K₂O) status also shows clear differences between land uses. Almost half of arable soils (46%) are potassium-deficient, 32% are optimal, and 22% are excessive. This indicates a considerable risk of deficiency, especially in crops with high potassium requirements. In permanent crops, the situation is more favorable – more than half of soils (52%) are optimally supplied, pointing to relatively balanced fertilization, although about a quarter are deficient and another quarter excessive. The largest deficiency occurs in grasslands, where 60% of soils are potassium-deficient, only 21% are optimal, and 19% excessive. These results are somewhat unexpected, since grasslands are often fertilized with livestock manures, which are rich in potassium. However, it is well known that potassium binds less strongly to soil (especially in light soils) and is therefore more mobile and prone to leaching. The findings emphasize the need for systematic potassium supplementation on grasslands and arable land, while avoiding surpluses in permanent crops.
Combined phosphorus (P₂O₅) and potassium (K₂O) status reveals very distinct patterns among land uses. On arable land, 18% of soils are simultaneously deficient in both P and K, 11% are optimal, and 12% excessive. This shows that the share of soils with balanced nutrient supply is relatively low, while deficiency or surplus predominates. In permanent crops, the situation is somewhat better: 19% of soils are optimal in both nutrients, while 13% are deficient and 15% excessive, again reflecting heterogeneous fertilization practices. The most critical situation is in grasslands, where as much as 50% of soils show simultaneous deficiency of both P and K, only 2% are optimal, and 6% excessive. This demonstrates that grasslands suffer from a double nutrient deficit, which can directly reduce productivity and forage quality. The results underline the need for more balanced fertilization, particularly in grasslands, where nutrient removal is intense and replacement insufficient.
Methodology
Gerlušnik, A., Vrščaj, B., 2022. Vzorčenje za potrebe spremljanja stanja kmetijskih tal v letu 2022 : končno poročilo. Ljubljana : Kmetijski inštitut Slovenije, 2022.
Gerlušnik, A., Vrščaj, B., Gričnik, M., 2023. Vzorčenje kmetijskih tal : Spremljanje stanja kmetijskih tal v letu 2023 : končno poročilo
Gerlušnik, A., Vrščaj, B., 2023. Krovno spremljanje stanja kmetijskih tal v letu 2023 : končno poročilo.
Ljubljana : Kmetijski inštitut Slovenije, 2023.
Gerlušnik, A., Vrščaj, B., Sušin, J., Verbič, J., Potočnik, M., Gričnik, M., 2024. Krovno spremljanje stanja kmetijskih tal v letu 2024 : končno poročilo. Ljubljana : Kmetijski inštitut Slovenije,2024.
Mihelič, R., Čop, J., Jakše, M., Štampar, F., Majer, D., Tojnko, S., Vršič, S., 2010. Smernice za strokovno utemeljeno gnojenje. Republika Slovenija, Ministrstvo za kmetijstvo, gozdarstvo in prehrano, Ljubljana.
Mali, B., Marinšek, A., Žlindra, D., Simončič,P., Bergant,J., Šinkovec, M., Mežič, P., Vrščaj, B., Zupan, M., Grčman, H., 2016. Poročilo o izvedbi javnega naročila : Izdelava pilotnega vzorčenja tal za oceno zalog ogljika na kmetijskih zemljiščih. Ljubljana : Gozdarski inštitut Slovenije : Kmetijski inštitut Slovenije : Univerza v Ljubljani, Biotehniška fakulteta, 2016.
Mali, B., Marinšek, A., Voglar, G.,Žlindra, D., Simončič,P., Bergant,J., Šinkovec, M., Hladnik, J., Vrščaj, B., 2017. Vzorčenje tal za oceno zalog ogljika na kmetijskih zemljiščih v letu 2017 : poročilo o izvedbi naloge javnega naročila. Ljubljana : Gozdarski inštitut Slovenije : Kmetijski inštitut Slovenije : Univerza v Ljubljani, Biotehniška fakulteta, 2017.
Mali, B., Marinšek, A., Voglar, G., Kozamernik, E., Železnik, P., Žlindra, D., Simončič,P., Bergant,J., Šinkovec, M., Vrščaj, B., 2018. Vzorčenje tal za oceno zalog ogljika na kmetijskih zemljiščih v letu 2018 : poročilo o izvedbi naloge javnega naročila. Ljubljana : Gozdarski inštitut Slovenije : Kmetijski inštitut Slovenije : Univerza v Ljubljani, Biotehniška fakulteta, 2018.
Šinkovec, M., Bergant,J., Vrščaj, B., Mali, B., Marinšek, A., Voglar, G., Žlindra, D., Simončič,P., Mihelič, R., Turniški R., Zupan, M., Grčman, H., 2019. Vzorčenje v tleh in v lesnih ostankih iz trajnih nasadov za oceno zalog ogljika na kmetijskih zemljišč ih v letu 2020 : sklop A - Vzorčenje tal : zaključno poročilo. Ljubljana : Kmetijski inštitut Slovenije : Gozdarski inštitut Slovenije ; Biotehniška fakulteta, Oddelek za agronomijo, 2020
Zagorac, E., Bergant, J., Gričnik, M., Vrčaj, B., 2023. Primerjava podatkov analize kmetijskih tal iz sistema LUCAS z nacionalnim načinom spremljanja stanja kmetijskih tal : končno poročilo. Ljubljana : Kmetijski inštitut Slovenije, 2023


