[EN17] Electricity production by fuel

Key message

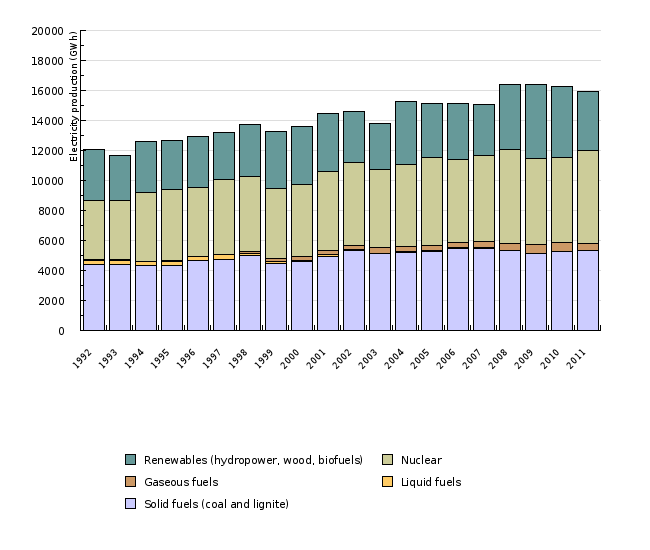
In 2011 continued the dominance of solid fuels for the production of electricity, which has been available for use in Slovenia, but the share is slowly decreasing. Followed by renewable energy sources to 30% share and of nuclear energy has been produced 24% of electricity. The share of electricity produced from domestic sources was 80% above the target set by the Resolution of the National Energy Program.
Definition
The indicator electricity production by fuel shows the total gross electricity production by fuel in the country. This means that it includes the production of electric power plants by main activities, production of autoproducers and production of small hydroelectric power plants. The production is subdivided into the following fuels: solid fuels (lignite and brown coal), liquid fuels (extra light fuel oil, residual fuel oil), gaseous fuels (natural gas), nuclear energy, renewable energy sources (biomass and waste, hydropower, wind energy, solar energy, geothermal energy) and other fuels.
Charts
Statistical Office of the Republic of Slovenia, 2012;
Jožef Stefan Institute, 2012; Eurostat, 2012.
| 1992 | 1993 | 1994 | 1995 | 1996 | 1997 | 1998 | 1999 | 2000 | 2001 | ||
|---|---|---|---|---|---|---|---|---|---|---|---|
| Solid fuels (coal and lignite) | GWh | 4370 | 4432 | 4336 | 4343 | 4673 | 4710 | 4988 | 4480 | 4611 | 4919 |
| Liquid fuels | GWh | 307 | 259 | 269 | 261 | 261 | 345 | 140 | 142 | 55 | 126 |
| Gaseous fuels | GWh | 25 | 23 | 18 | 30 | 8 | 10 | 109 | 172 | 293 | 296 |
| Nuclear | GWh | 3971 | 3956 | 4609 | 4779 | 4562 | 5019 | 5019 | 4696 | 4761 | 5257 |
| Renewables (hydropower, wood, biofuels) | GWh | 3413 | 3022 | 3399 | 3241 | 3449 | 3092 | 3449 | 3772 | 3904 | 3868 |
| Total | GWh | 12086 | 11692 | 12631 | 12654 | 12953 | 13176 | 13705 | 13262 | 13624 | 14466 |
| 2002 | 2003 | 2004 | 2005 | 2006 | 2007 | 2008 | 2009 | 2010 | 2011 | ||
| Solid fuels (coal and lignite) | GWh | 5303 | 5108 | 5192 | 5275 | 5460 | 5485 | 5323 | 5131 | 5289 | 5308 |
| Liquid fuels | GWh | 66 | 50 | 43 | 37 | 45 | 29 | 17 | 28 | 9 | 17 |
| Gaseous fuels | GWh | 289 | 370 | 358 | 340 | 373 | 452 | 475 | 594 | 548 | 489 |
| Nuclear | GWh | 5528 | 5207 | 5459 | 5884 | 5548 | 5695 | 6273 | 5739 | 5657 | 6215 |
| Renewables (hydropower, wood, biofuels) | GWh | 3414 | 3086 | 4221 | 3581 | 3688 | 3382 | 4310 | 4909 | 4745 | 3883 |
| Total | GWh | 14600 | 13821 | 15273 | 15117 | 15114 | 15043 | 16398 | 16401 | 16433 | 16056 |
Statistical Office of the Republic of Slovenia, 2009;
Jožef Stefan Institute, 2009; Eurostat, 2009.
| 1992 | 1993 | 1994 | 1995 | 1996 | 1997 | 1998 | 1999 | 2000 | 2001 | ||
|---|---|---|---|---|---|---|---|---|---|---|---|
| Solid fuels (coal and lignite) | GWh | 4370 | 4432 | 4336 | 4343 | 4673 | 4710 | 4988 | 4480 | 4611 | 4919 |
| Liquid fuels | GWh | 307 | 259 | 269 | 261 | 261 | 345 | 140 | 142 | 55 | 126 |
| Gaseous fuels | GWh | 25 | 23 | 18 | 30 | 8 | 10 | 109 | 172 | 293 | 296 |
| Nuclear | GWh | 3971 | 3956 | 4609 | 4779 | 4562 | 5019 | 5019 | 4696 | 4761 | 5257 |
| Renewables (hydropower, wood, biofuels) | GWh | 3413 | 3022 | 3399 | 3241 | 3449 | 3092 | 3449 | 3772 | 3904 | 3868 |
| Total | GWh | 12086 | 11692 | 12631 | 12654 | 12953 | 13176 | 13705 | 13262 | 13624 | 14466 |
| Solid fuels (coal and lignite) | [%] | 36 | 38 | 34 | 34 | 36 | 36 | 36 | 34 | 34 | 34 |
| Liquid fuels | [%] | 3 | 2 | 2 | 2 | 2 | 3 | 1 | 1 | 0 | 1 |
| Gaseous fuels | [%] | 0 | 0 | 0 | 0 | 0 | 0 | 1 | 1 | 2 | 2 |
| Nuclear | [%] | 33 | 34 | 36 | 38 | 35 | 38 | 37 | 35 | 35 | 36 |
| Renewables (hydropower, wood, biofuels) | [%] | 28 | 26 | 27 | 26 | 27 | 23 | 25 | 28 | 29 | 27 |
| Other | [%] | 0 | 0 | 0 | 0 | 0 | 0 | 0 | 0 | 0 | 0 |
| 2002 | 2003 | 2004 | 2005 | 2006 | 2007 | 2008 | 2009 | 2010 | 2011 | ||
| Solid fuels (coal and lignite) | GWh | 5303 | 5108 | 5192 | 5275 | 5460 | 5485 | 5323 | 5131 | 5289 | 5308 |
| Liquid fuels | GWh | 66 | 50 | 43 | 37 | 45 | 29 | 17 | 28 | 9 | 17 |
| Gaseous fuels | GWh | 289 | 370 | 358 | 340 | 373 | 452 | 475 | 594 | 548 | 489 |
| Nuclear | GWh | 5528 | 5207 | 5459 | 5884 | 5548 | 5695 | 6273 | 5739 | 5657 | 6215 |
| Renewables (hydropower, wood, biofuels) | GWh | 3414 | 3086 | 4221 | 3581 | 3688 | 3382 | 4310 | 4909 | 4745 | 3883 |
| Total | GWh | 14600 | 13821 | 15273 | 15117 | 15114 | 15043 | 16398 | 16401 | 16433 | 16056 |
| Solid fuels (coal and lignite) | [%] | 36 | 37 | 34 | 35 | 36 | 36 | 32 | 31 | 32 | 33 |
| Liquid fuels | [%] | 0 | 0 | 0 | 0 | 0 | 0 | 0 | 0 | 0 | 0 |
| Gaseous fuels | [%] | 2 | 3 | 2 | 2 | 2 | 3 | 3 | 4 | 3 | 3 |
| Nuclear | [%] | 38 | 38 | 36 | 39 | 37 | 38 | 38 | 35 | 34 | 39 |
| Renewables (hydropower, wood, biofuels) | [%] | 23 | 22 | 28 | 24 | 24 | 22 | 26 | 30 | 29 | 24 |
| Other | [%] | 0 | 0 | 0 | 0 | 0 | 0 | 0 | 0 | 1 | 1 |
Statistical Office of the Republic of Slovenia, 2012;
Eurostat, 2012.
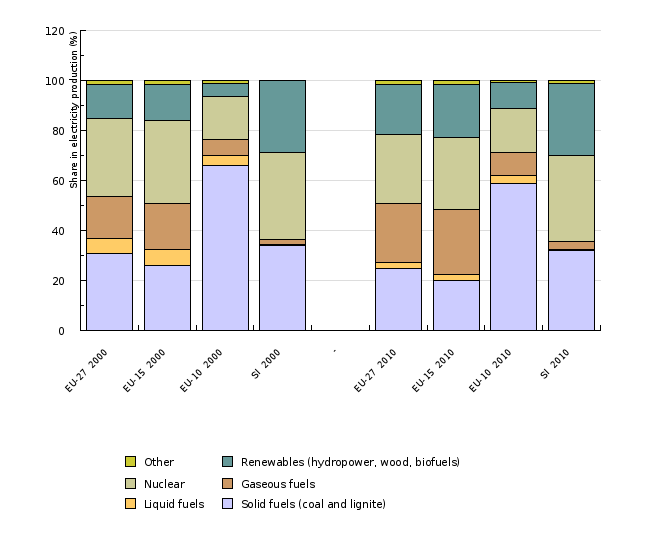
| EU-27 2000 | EU-15 2000 | EU-10 2000 | SI 2000 | - | EU-27 2010 | EU-15 2010 | EU-10 2010 | SI 2010 | ||
|---|---|---|---|---|---|---|---|---|---|---|
| Solid fuels (coal and lignite) | GWh | 932445 | 680588 | 215990 | 4611 | 830511 | 577106 | 209966 | 5288 | |
| Liquid fuels | GWh | 179273 | 162159 | 13054 | 55 | 83540 | 70406 | 12201 | 8 | |
| Gaseous fuels | GWh | 511108 | 478931 | 20998 | 293 | 789031 | 747283 | 32458 | 548 | |
| Nuclear | GWh | 944993 | 863915 | 57444 | 4761 | 916610 | 825748 | 63990 | 5657 | |
| Renewables (hydropower, wood, biofuels) | GWh | 414363 | 380360 | 16552 | 3904 | 667783 | 605953 | 36103 | 4742 | |
| Other | GWh | 42433 | 38198 | 3942 | 0 | 55481 | 51179 | 3292 | 190 | |
| Electricity production | GWh | 3024615 | 2604151 | 327980 | 13624 | 3342956 | 2877675 | 358010 | 16433 | |
| Solid fuels (coal and lignite) | % | 30.8 | 26.1 | 65.9 | 33.8 | 24.8 | 20.1 | 58.6 | 32.2 | |
| Liquid fuels | % | 5.9 | 6.2 | 4 | 0.4 | 2.5 | 2.4 | 3.4 | 0 | |
| Gaseous fuels | % | 16.9 | 18.4 | 6.4 | 2.2 | 23.6 | 26 | 9.1 | 3.3 | |
| Nuclear | % | 31.2 | 33.2 | 17.5 | 34.9 | 27.4 | 28.7 | 17.9 | 34.4 | |
| Renewables (hydropower, wood, biofuels) | % | 13.7 | 14.6 | 5 | 28.7 | 20 | 21.1 | 10.1 | 28.9 | |
| Other | % | 1.4 | 1.5 | 1.2 | 0 | 1.7 | 1.8 | 0.9 | 1.2 |
Statistical Office of the Republic of Slovenia, 2012; Eurostat, 2012.
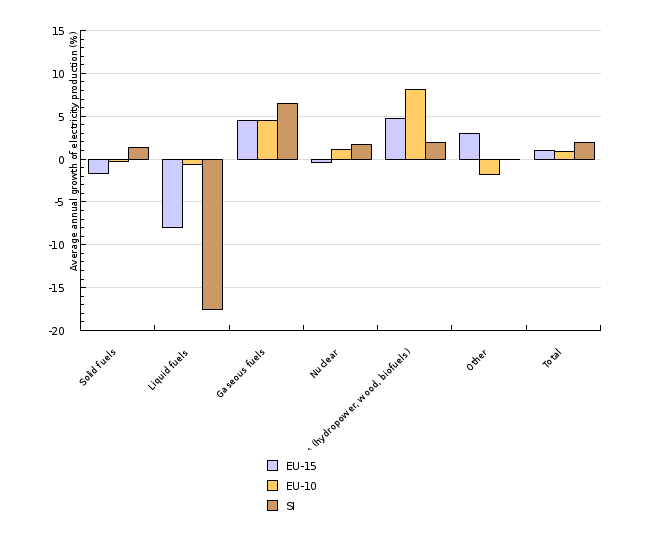
| Solid fuels | Liquid fuels | Gaseous fuels | Nuclear | Renewables (hydropower, wood, biofuels) | Other | Total | ||
|---|---|---|---|---|---|---|---|---|
| EU-15 | % | -1.6 | -8 | 4.5 | -0.5 | 4.8 | 3 | 1 |
| EU-10 | % | -0.3 | -0.7 | 4.5 | 1.1 | 8.1 | -1.8 | 0.9 |
| SI | % | 1.4 | -17.5 | 6.5 | 1.7 | 2 | 0 | 1.9 |
Goals
- balanced increase in the diversification of the use of primary energy sources;
- reduction of electricity production from coal and increase of electricity production from natural gas and renewable energy sources;
- 33.6 % share in gross consumption for electricity production from renewable energy sources.
Methodology
Data for Slovenia and other countries
Objectives summarised by: Resolucija o Nacionalnem energetskem programu (ReNEP) (Resolution on the National Energy Programme, Official Gazette of the RS, No. 57/04).
Source database or source: Data from two sources were used, while their consistency was verified on the basis of the data on electricity production by power plant type.
1992-2001: EUROSTAT – Data of EUROSTAT were used for the period 1992-1999, since there is no data of SORS available for this period. For 1996, the data on electricity production from RES were corrected, so that they matched with the SORS data for the production of hydroelectric power plants and that production from solid fuels matched with total electricity production. The data were obtained from a web application: Environment and energy > Energy > Energy Statistics – quantities > Supply, transformation, consumption - electricity - annual data.
2002-2008: SORS. The data were obtained in the SI-STAT Data Portal: Environment and natural sources > Energy > Electricity > Gross production and net power plant capacity by energy sources, Slovenia, annual.
Data administrator: Statistical Office of the Republic of Slovenia – Jože Zalar and EUROSTAT.
Data acquisition date for the indicator: 8 December 2009
Methodology and frequency of data collection for the indicator: The data on electricity production were prepared (collected) on an annual basis and published on the web site of SORS and in printed publications. Furthermore, the data were communicated to the Statistical Office of the European Communities (EUROSTAT). The EUROSTAT/IEA methodology was used for the preparation of data. Two different sources of information were used – EUROSTAT was the source of information before 2000 and the official statistics of SORS after 2000.
The data on electricity production by the following fuels were used for the indicator: solid fuels (lignite and brown coal), liquid fuels (extra light fuel oil, residual fuel oil), gaseous fuels (natural gas), nuclear energy, renewable energy sources (biomass and waste, hydropower, wind energy, solar energy, geothermal energy) and other fuels. The EUROSTAT data were used for the following categories: 107000 Total gross electricity generation, 107001 Gross electricity generation - Hydro power plants, 107002 Gross electricity generation - Geothermal power plants, 107003 Gross electricity generation - Nuclear power plants, 107005 Gross electricity generation - Wind turbines, 107006 Gross electricity generation - Coal-fired power stations, 107007 Gross electricity generation - Lignite-fired power stations, 107008 Gross Electricity Generation - Oil-Fired Power Stations, 107009 Gross electricity generation - Natural gas-fired power stations, 107010 Gross electricity generation - Derived gas-fired power stations, 107011 Gross electricity generation - Biomass-fired power stations, 107012 Gross electricity generation - Other power stations, 107023 Gross production from photovoltaic systems.
Data processing methodology: The average annual growth of electricity production is calculated as [(last year/base year)(1/number of years) –1]*100.
The share of electricity production by fuel was calculated as a quotient of electricity production by fuel type and total gross electricity production in the country.
The annual growth for the indicator is sometimes shown in percentage points. A percentage point is a unit used for the comparison of different rates of growth. A percentage point includes an absolute comparison calculated by the formula (nthis year)-(nlast year)=16 %-15 %=1 pp (for instance: if last year the growth was 15 % and this year 16 %, then this year the growth was higher by 1 percentage point). The difference in growth can also be expressed in a relative comparison using the formula [(nthis year/nlast year)*100]–100=[(16 %/15 %)*100]–100=6.7 %, where the growth is indicated in percentages.
Geographical coverage: The EU-25 includes the following EU Member States: Austria, Belgium, Cyprus, the Czech Republic, Denmark, Estonia, Finland, France, Germany, Greece, Hungary, Italy, Latvia, Lithuania, Luxembourg, Malta, the Netherlands, Poland, Portugal, Republic of Ireland, Slovakia, Slovenia, Spain, Sweden, and the United Kingdom. The EU-15 is composed of older EU Member States: Austria, Belgium, Denmark, Finland, France, Germany, Greece, Ireland, Italy, Luxembourg, the Netherlands, Portugal, Spain, Sweden, the United Kingdom. The EU-10 includes Member States that joined the EU in 2004 (Cyprus, Czech Republic, Estonia, Hungary, Lithuania, Latvia, Malta, Poland, Slovenia, Slovakia).
Information concerning data quality:
- Advantages and disadvantages of the indicator: The officially reported data, calculated on the basis of internationally confirmed methodologies, were used for the indicator. Despite the fact that they come from two different sources, the data are consistent, which was determined by a comparison of electricity production by fuel and type of power plants (thermal, hydro, nuclear). For the period 1992-1995, the data of the ministry responsible for energy were used for comparison; after 1996, the data of the SORS were used.
- Relevance, accuracy, robustness, uncertainty:
Reliability of the indicator (archival data): The data are reliable.
Uncertainty of the indicator (scenarios/projections): Scenarios and projections are not available.
- Overall assessment (1 = no major comments, 3 = data to be considered with reservation):
Relevance: 1
Accuracy: 2
Completeness over time: 1
Completeness over space: 1
Other sources and literature:
- EEA, 2007. EN27 Electricity production by fuel.
- ELES, 2008. Letno poročilo 2007 (Annual report 2007).
- ELES, 2009. Elektroenergetski sistem Slovenije 2008 (Electricity system of Slovenia 2008).
- MESP, 2009. Operativni program zmanjševanja emisij toplogrednih plinov do leta 2012 (Operational programme for limiting greenhouse gas emissions until 2012).
- Šoštanj thermal power plant, 2009. BilTEŠ 2008 (Annual reports).


