[OD17] Waste generated by manufacturing and service activities

Key message

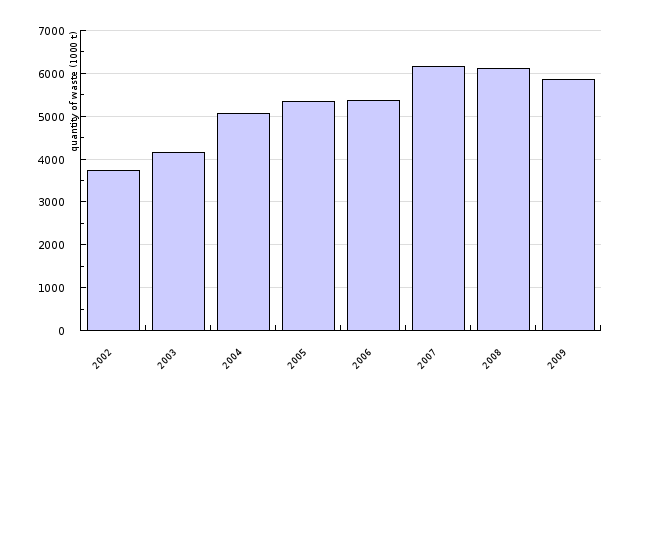
After 2007, when it reached its peak, the quantity of waste generated by manufacturing and service activities started to decrease. In 2009, 5.85 million tonnes of such waste was generated. In recent years, the quantity of recovered and deposited waste has been increasing.
Definition
This indicator shows the quantities of waste generated from manufacturing and service activities in Slovenia, the relation between the recovered and disposed waste by year and the comparison of growth in the quantities of generated waste with the GDP.
Waste from manufacturing and service activities is generated by a great variety of processes and activities and is classified in groups of waste with regard to its source of origin, i.e. waste from inorganic chemical processes, waste from the photographic industry, etc. Groups of waste are specified in the Annex to the Decree on waste management (Official Gazette of the Republic of Slovenia, No.34/08), where proper treatment of this waste is also prescribed.
Charts
Waste Management Database, Environmental Agency of the Republic of Slovenia, 2010
| 2002 | 2003 | 2004 | 2005 | 2006 | 2007 | 2008 | 2009 | ||
|---|---|---|---|---|---|---|---|---|---|
| Waste generated - non-hazardous and hazardous | 1000 t | 3731 | 4146.8 | 5067.6 | 5336.6 | 5358.7 | 6150 | 6111.4 | 5847.4 |
| Waste generated - non-hazardous | 1000 t | 6046.8 | 5960.5 | 5751.7 | |||||
| Waste generated - hazardous | 1000 t | 103.2 | 150.9 | 95.7 |
Waste Management Database, Environmental Agency of the Republic of Slovenia, 2010, National Accounts, Statistical office of the RS, 2010
| 2002 | 2003 | 2004 | 2005 | 2006 | 2007 | 2008 | 2009 | ||
|---|---|---|---|---|---|---|---|---|---|
| Waste from production and service activities | 1000 t | 3731 | 4147 | 5068 | 5337 | 5359 | 6150 | 6111 | 5847 |
| Waste from production and service activities | index (2002=100) | 100 | 111 | 136 | 143 | 144 | 165 | 164 | 157 |
| GDP | mio EUR | 23128 | 25114 | 27073 | 28750 | 31050 | 34568 | 37305 | 35384 |
| GDP | index(2002=100) | 100 | 109 | 117 | 124 | 134 | 149 | 161 | 153 |
Statistical Office of the RS, 2010
| Manufacturing | Electricity, gas, steam and air conditioning supply |
Construction | Mining and quarrying | Agriculture, forestry and fishing |
Wholesale and retail trade, repair of moto vehicles and motocycles |
Other | ||
|---|---|---|---|---|---|---|---|---|
| 2002 | 000 t | 1584 | 1798 | 302 | 94 | 86 | 21 | 94 |
| 2003 | 000 t | 1471 | 1754 | 625 | 332 | 334 | 24 | 79 |
| 2004 | 000 t | 2163 | 1547 | 1437 | 129 | 237 | 129 | 230 |
| 2005 | 000 t | 2089 | 1550 | 1030 | 280 | 236 | 136 | 221 |
| 2006 | 000 t | 2241 | 1536 | 1162 | 474 | 242 | 113 | 163 |
| 2007 | 000 t | 2022 | 1520 | 1706 | 96 | 218 | 200 | 285 |
SI-STAT data portal, Waste from production and service activities, Statistical office of the RS, 2010
| Construction | Manufacturing | Electricity, gas, steam and air conditioning supply |
Agriculture, forestry and fishing |
Water supply, sewerage, waste management and remediation activities |
Wholesale and retail trade, repair of moto vehicles and motocycles |
Mining and quarrying | Professional, scientific and technical activities |
Other | ||
|---|---|---|---|---|---|---|---|---|---|---|
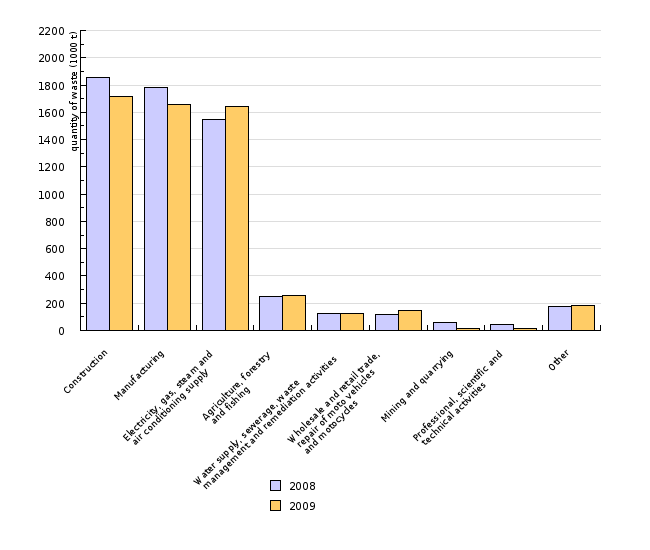
| 2008 | 1000 t | 1858.7 | 1785.5 | 1546.2 | 251.2 | 123.4 | 115.8 | 56.5 | 47.2 | 176 |
| 2009 | 1000 t | 1716 | 1653.9 | 1644.9 | 256.9 | 122.2 | 149.7 | 11.8 | 11.1 | 185.1 |
Waste Management Database, Environmental Agency of the RS, 2010
| 2002 | 2003 | 2004 | 2005 | 2006 | 2007 | 2008 | 2009 | ||
|---|---|---|---|---|---|---|---|---|---|
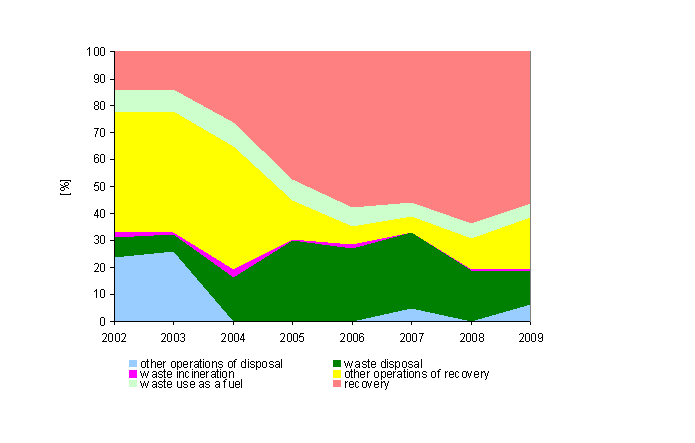
| other operations of disposal | 1000 t | 894.1 | 1065.9 | 0 | 1.1 | 0 | 254.9 | 2.7 | 324.1 |
| waste disposal | 1000 t | 268.3 | 272 | 700.1 | 1390.5 | 1283.2 | 1533 | 1058.5 | 614 |
| waste incineration | 1000 t | 56.3 | 20.2 | 105.6 | 19.5 | 82.6 | 4.8 | 4.4 | 41.4 |
| other operations of recovery | 1000 t | 1663 | 1873.4 | 1947 | 679.9 | 311.3 | 340.8 | 673.1 | 1000.9 |
| waste use as a fuel | 1000 t | 313.1 | 332.2 | 372.4 | 360.9 | 339.3 | 280 | 290.9 | 258 |
| recovery | 1000 t | 536.2 | 583.1 | 1115.5 | 2202.1 | 2752.9 | 3031.8 | 3584.9 | 2862.7 |
Goals
· Decoupling of waste generation from economic activities;
· separate collection of waste at source;
· effective treatment (mechanical, biological, thermal) of the remaining waste after separate collection;
· pre-disposal treatment of at least 65% of generated waste from manufacturing and service activities.
Comment
The majority of waste generated in Slovenia originates from manufacturing and service activities.
After 2007, when it reached its peak, the quantity of waste generated from manufacturing and service activities in Slovenia started to decline. In the period 2002–2007, the quantity of generated waste increased by almost 65%, which was followed by a slight decline in 2008. In 2009, 5.85 million tonnes of waste from manufacturing and service activities were generated. Compared to 2008, the quantity decreased by 4.3% in 2009.
In 2008 and 2009, the growth of generated waste from manufacturing and service activities continued to exceed economic growth: when GDP growth was low, it decreased slightly, closely approaching the economic growth rate. The reduction of waste in certain sectors after 2008 is largely a consequence of the economic crisis, which reduced economic activity in Slovenia. In the upcoming years, we must continue pursuing one of the goals of the Sixth Environmental Action Programme, i.e. decoupling of waste generation from economic activities, so that economic growth will no longer be directly related to the accumulation of waste.
In 2007, most waste from manufacturing and service activities was generated in sectors of manufacturing (31%) and construction (29%), followed by the sectors of electricity, gas and water supply (26%). The rest (14%) was generated by other activities. In the period 2002–2007, the highest increase in waste was recorded in construction (more than 4-fold increase), while waste in the sector of electricity, gas and water supply was reduced by 15%.
In 2008, a new standard classification of waste (SKD 2008) that reflected structural changes in the economy in recent years was introduced in Slovenia. According to new classification, the largest quantity of waste from manufacturing and service activities in 2008 was generated in the sectors of construction (31%), manufacturing (30%) and electricity, gas and steam supply (26%). In 2009, the structure remained more or less the same, with the construction sector representing 30%, manufacturing 29% and electricity, gas and steam supply 29%.
In 2009, 81% of waste from manufacturing and service activities was recovered (4.1 million tonnes), while 19% was disposed of (1 million tonnes). Most recovered waste was recycled (70%), while most disposed waste was deposited (63%). In the period 2002–2008, the quantity of recovered waste increased by 60%. In 2008, 7-times more waste (3.6 million tonnes) was recycled than in 2002. Compared to 2008, recovery was reduced by 9% in 2009. The quantities of deposited waste increased as well – in 2007, they were 6-times larger (1.7 million tonnes) than in 2002. Compared to 2007, 30% less (1.2 million tonnes) was deposited in 2008 and 60% less (614,000 tonnes) in 2009. This is a significant shift from disposal to recovery, which should continue in the future.
In order to further reduce the quantities of generated waste, the current linear production system will need to be replaced by a circular one in which waste will be used as raw materials. Here, companies will play a crucial role, as they will have to take environmental protection into account in designing and manufacturing products. They will have to manufacture products that contain fewer hazardous substances and more materials that facilitate recycling.
Methodology
Data for Slovenia:
Objectives summarized by: Operational Programme on waste deposition aiming at the reduction of deposited quantities of biodegradable waste.
Source database or source: Waste Management Documents, Environmental Agency of the Republic of Slovenia and Statistical Office of the Republic of Slovenia.
Data administrator: Environmental Agency of the Republic of Slovenia.
Data acquisition date for this indicator: 16 December 2009
Methodology and frequency of data collection for the indicator: Data have been captured for the 2002-2008 period; collected annually. Environmental Agency of the Republic of Slovenia, gathers data on waste generation and management of all types of waste in the Republic of Slovenia.
Obligation to report data on waste management is provided on the basis of the Environment Protection Act (Official Gazette of the Republic of Slovenia, Nos. 41/04, 20/06 and 70/08 ), and specified in detail in the Decree on waste management (Official Gazette of the Republic of Slovenia, No. 34/08), and up to 2008, in the Rules on waste management (Official Gazette of the Republic of Slovenia, Nos. 84/98, 45/00, 20/01, 13/03), respectively.
According to the Rules on waste management, obligation to report on waste from industrial and service activities comprises reporting obligation on generated waste and its management by generators of waste, collectors, recoverers or disposers of non-hazardous and of hazardous waste from industrial and other activities above the prescribed limit (10 tonnes for non-hazardous waste and 5 kg for hazardous waste). Reports shall be submitted annually, by 31 March for the past calendar year. Data for generated quantities include quantities of hazardous and non-hazardous waste from industrial and service activities, while since 2007 management data are required only for non-hazardous waste from industrial and service activities.
Data processing methodology: The graph in Figure OD17-1 shows data on total quantity of waste generated from production and service activities, taking into account both hazardous and non-hazardous waste.
Figure OD17-2 shows generated quantities of non-hazardous industrial waste in Slovenia by sectors (in 000 tonnes).
Figure OD17-3 presents management of non-hazardous waste from production and service activities, and shares of their recovery and disposal for the 2002-2008 period.
Information concerning data quality:
- Advantages and disadvantages of the indicator:/
- Relevance, accuracy, robustness, uncertainty: /
Reliability of the indicator (archival data):/
Uncertainty of the indicator (scenarios/projections):/
- Overall assessment (1 = no major comments, 3 = data to be considered with reservation):
Relevance: 1
Accuracy: 2
Completeness over time: 2
Completeness over space: 1


