[OD13] Packaging waste 

Key message

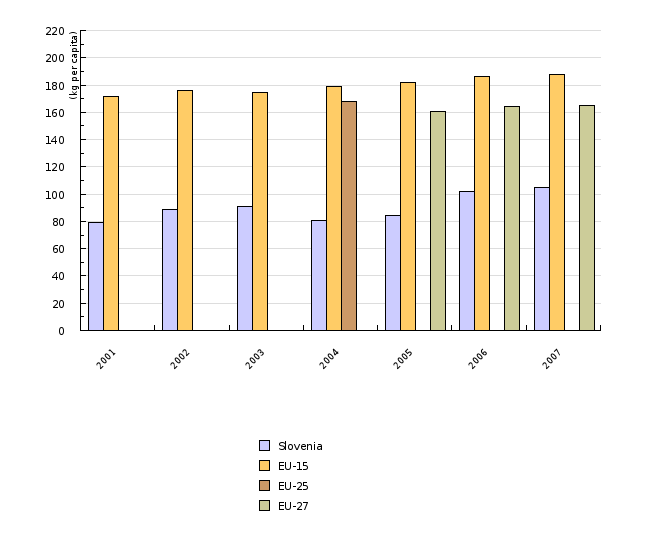
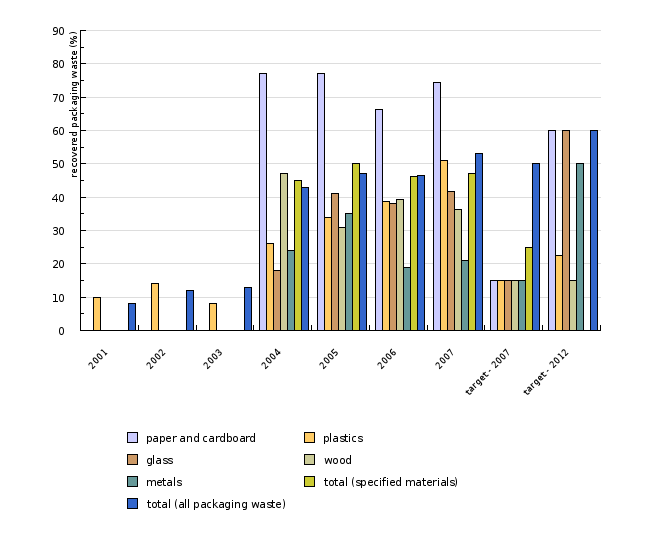
The quantity of generated packaging waste is increasing. In 2007, 212,084 tonnes of packaging waste was generated, i.e. 105 kg of packaging waste per capita. 53% of packaging waste was recovered and 47% recycled, which was in accord with the objectives set for 2007; in the years to come, however, we will have to increase the recovery and recycling of packaging waste disposed of within municipal waste to reach the set targets.
Definition
The indicator shows the quantity of packaging waste generated per capita, decoupling of the quantity of produced packaging from the GDP, the quantity of produced and recovered packaging waste by material and the shares of recovered and recycled packaging waste relative to the set objectives.
Packaging is defined as products made of any type of material intended to cover or hold goods (raw materials or final products) for the purpose of storage or protection, handling, delivery or presentation on the route from the packaging facility to the end user (Decree on the management of packaging and packaging waste, Official Gazette of the Republic of Slovenia, No. 84/06, 106/06 and 110/07). In addition, all products and items listed in Article 3 of this Decree also constitute packaging.
Charts
Analysis of annual reports on waste management in 2005; Waste Management Database, Environmental Agency of the Republic of Slovenia, 2009
| 2001 | 2002 | 2003 | 2004 | 2005 | 2006 | 2007 | ||
|---|---|---|---|---|---|---|---|---|
| Slovenia | kg per capita | 79 | 89 | 91 | 81 | 84 | 102 | 105 |
| EU-15 | kg per capita | 172 | 176 | 174 | 179 | 182 | 186 | 188 |
| EU-25 | kg per capita | 168 | ||||||
| EU-27 | kg per capita | 161 | 165 | 165 |
Analysis of annual reports on waste management in 2007; Waste Management Database, Environmental Agency of the Republic of Slovenia, 2009
| 2001 | 2002 | 2003 | 2004 | 2005 | 2006 | 2007 | ||
|---|---|---|---|---|---|---|---|---|
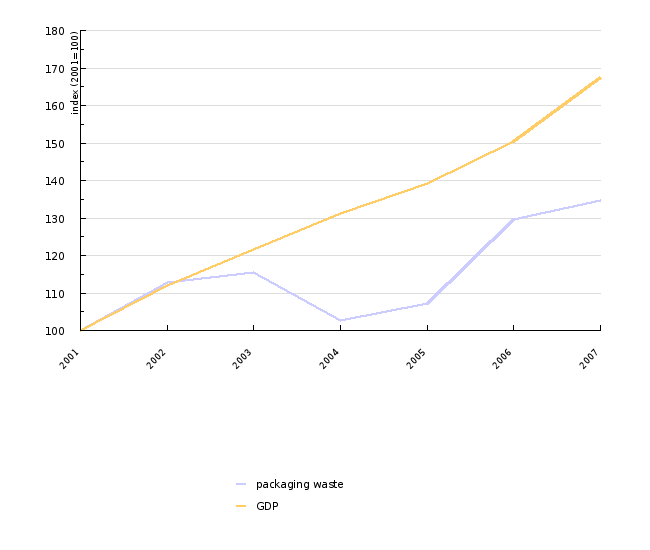
| packaging waste | t | 157481 | 177547 | 182000 | 161507 | 168630 | 204185 | 212084 |
| GDP | mio EUR | 20654 | 23128 | 25114 | 27073 | 28750 | 31050 | 34568 |
| packaging waste | index (2001=100) | 100 | 113 | 116 | 103 | 107 | 130 | 135 |
| GDP | index (2001=100) | 100 | 112 | 122 | 131 | 139 | 150 | 167 |
Analysis of annual reports on waste management in 2007; Waste Management Database, Environmental Agency of the Republic of Slovenia, 2009
| 2001 - generated | 2001 - recovered | 2002 - generated | 2002 - recovered | 2003 - generated | 2003 - recovered | 2004 - generated | 2004 - recovered | 2004 - recycled | 2005 - generated | ||
|---|---|---|---|---|---|---|---|---|---|---|---|
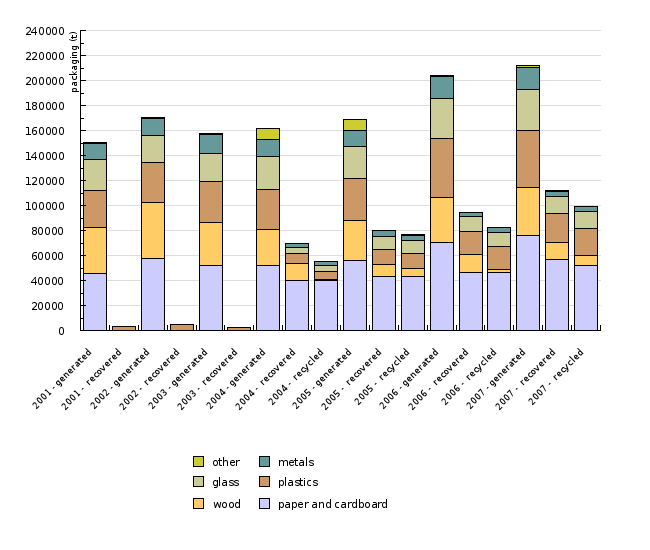
| paper and cardboard | t | 45891 | np | 57575 | np | 52120 | np | 52202 | 39880 | 39790 | 56030 |
| wood | t | 36510 | np | 44972 | np | 34393 | np | 28520 | 13416 | 1313 | 31590 |
| plastics | t | 29883 | 3026 | 31463 | 4529 | 32598 | 2517 | 32345 | 8305 | 6115 | 33940 |
| glass | t | 24118 | np | 21842 | np | 22823 | np | 26228 | 4694 | 4694 | 25650 |
| metals | t | 13329 | np | 13769 | np | 14506 | np | 13798 | 3315 | 3315 | 13120 |
| other | t | 385 | np | 642 | np | 864 | np | 8414 | 214 | 197 | 8300 |
| total | t | 157480 | 12252 | 177547 | 21396 | 164390 | 21445 | 161507 | 69824 | 55424 | 168630 |
| 2005 - recovered | 2005 - recycled | 2006 - generated | 2006 - recovered | 2006 - recycled | 2007 - generated | 2007 - recovered | 2007 - recycled | ||||
| paper and cardboard | t | 43339 | 43316 | 70416 | 46760 | 46699 | 76268 | 56653 | 52222 | ||
| wood | t | 9728 | 6478 | 36182 | 14204 | 1890 | 38241 | 13890 | 8043 | ||
| plastics | t | 11507 | 11506 | 47348 | 18304 | 18299 | 45731 | 23302 | 21248 | ||
| glass | t | 10405 | 10405 | 31259 | 11902 | 11902 | 32292 | 13514 | 13514 | ||
| metals | t | 4633 | 4633 | 18077 | 3443 | 3443 | 18187 | 3803 | 3803 | ||
| other | t | 66 | 66 | 899 | 79 | 79 | 1365 | 1207 | 700 | ||
| total | t | 79678 | 76404 | 204181 | 15424 | 82312 | 212085 | 112369 | 99530 |
Analysis of annual reports on waste management in 2007; Waste Management Database, Environmental Agency of the Republic of Slovenia, 2009
| 2001 | 2002 | 2003 | 2004 | 2005 | 2006 | 2007 | target - 2007 | target - 2012 | ||
|---|---|---|---|---|---|---|---|---|---|---|
| paper and cardboard | % | np | np | np | 77 | 77 | 66 | 74 | 15 | 60 |
| plastics | % | 10 | 14 | 8 | 26 | 34 | 39 | 51 | 15 | 23 |
| glass | % | np | np | np | 18 | 41 | 38 | 42 | 15 | 60 |
| wood | % | np | np | np | 47 | 31 | 39 | 36 | 15 | 15 |
| metals | % | np | np | np | 24 | 35 | 19 | 21 | 15 | 50 |
| total (specified materials) | % | np | np | np | 45 | 50 | 46 | 47 | 25 | np |
| total (all packaging waste) | % | 8 | 12 | 13 | 43 | 47 | 46 | 53 | 50 | 60 |
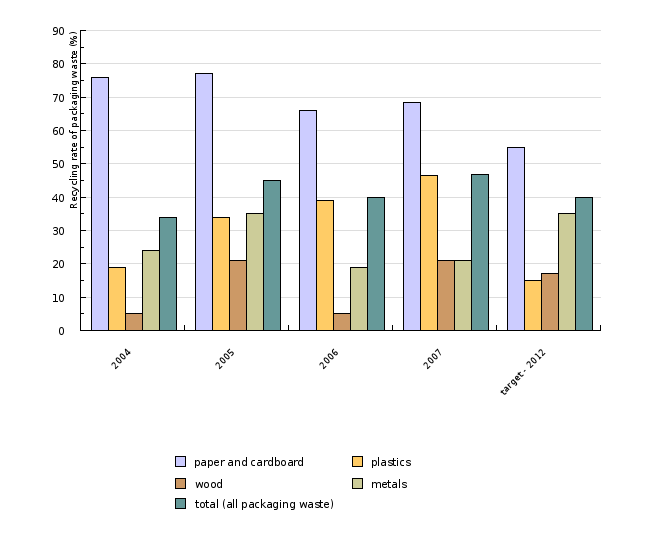
Analysis of annual reports on waste management in 2007; Waste Management Database, Environmental Agency of the Republic of Slovenia, 2009.
| 2004 | 2005 | 2006 | 2007 | target - 2012 | ||
|---|---|---|---|---|---|---|
| paper and cardboard | % | 76 | 77 | 66 | 69 | 55 |
| other | % | 2 | 1 | 9 | 51 | |
| plastics | % | 19 | 34 | 39 | 47 | 15 |
| wood | % | 5 | 21 | 5 | 21 | 17 |
| metals | % | 24 | 35 | 19 | 21 | 35 |
| total (all packaging waste) | % | 34 | 45 | 40 | 47 | 40 |
Goals
Up to 31 December 2007, the following targets applied to Slovenia:
- Recovery : from 50% to 65% of total mass of packaging waste;
- Recycling : from 25% to 45% of total mass of packaging waste, of which no less than 15% of the mass by type of packaging material.
Up to 31 December 2012, the following targets apply:
- Recovery : at least 60% of total mass of packaging waste
- Recycling: from 55% to 80% of total mass of packaging waste, and by type of packaging material: 60% for glass, 60% for paper and cardboard, 50% for metals, 22.5% for plastic and 15% for wood.
Comment
Quantity of generated packaging depends both on consumers' behaviour and on production and distribution patterns. Packaging waste is generated in households and in production and service activities.
The quantity of generated packaging has been increasing since 2004, when a slight decline was registered. In 2007, 212,084 tonnes of packaging waste, i.e. 105 kg of packaging waste per capita, was generated, which is by 31 per cent above the 2004 quantities. In 2007, Slovenia generated 36% of waste paper and cardboard packaging (76,268 tonnes), followed by plastic packaging waste with 21% (45,731 tonnes), wooden packaging waste with 18% (38,241 tonnes), glass packaging waste with 15% (32,292 tonnes) and metal packaging waste with 9% (18,187 tonnes). Other generated packaging waste, covering mixed and composite packaging waste, and packaging of hazardous material, amounted of 1% (1,365 tonnes).
Up to 2003, the quantities of generated packaging waste grew parallel to the GDP; after 2003 packaging waste generation decoupled from GDP, but the quantity of packaging waste continues to grow in absolute terms.
Management of packaging waste holds a special position in waste management, not just because of generated quantities and risk potential, but rather because of its enormous volume, considerable share of included organic kitchen substances and extraordinary prevalence of packaging waste generation in our everyday life.
In 2007, packaging waste was managed by two companies, SLOPAK and INTERSEROH. The companies collected approximately 191.000 tonnes of packaging waste from households, production and service activities. In accordance with the 2001 Order on the management of separately collected fractions in the public service of urban waste management, collection centres have been gradually set up for household packaging waste based on the number of inhabitants in each municipality. Household packaging waste is collected by a local public service responsible for municipal waste and transported to the waste management company, where it is further handled as necessary. Since the current system of separate collection of packaging waste with the system of collection centres does not provide for effective separation of packaging from mixed municipal waste, an increasing number of municipalities in Slovenia are introducing the »yellow bag« system. Households can deposit all (unseparated) packaging waste (except glass) into the yellow bag, and place the filled-up bag next to the container for other waste on the scheduled waste removal day. The to-date research in Slovenia has shown that the »yellow bag« system makes it possible to collect 3-times more municipal packaging waste per person than collection centre system; in this way, it is possible to collect at least 35 kg of municipal packaging waste per person per year. Packaging waste from production and service activities are delivered to the collecting company the liable entities.
EU Directive (94/62/EC) sets minimum recovery and recycling targets to be achieved by each Member State in the time stipulated. Slovenia as a new member State is obliged to reach the targets which applied to EU-15 Member Sates in 2001 by 2007, and the targets which applied to EU-15 Member Sates in 2008, by 2012.
In 2007, 53% of the total mass of packaging waste was recovered in Slovenia, and, thus, the objective for 2007 (50%) was attained. Paper, cardboard, plastic, wood, metals and glass reached 47% recovery, thereby exceeding the 2007 objective of 25 % recovery. In addition, objectives set for 2007 were exceeded for individual materials such as plastic, paper and cardboard, metals, glass and wood. However, in case of paper and cardboard and wooden packaging waste, only by a few percents. In 2007, we were still rather far behind the 2012 targets, dictating the recovery of no less than 60% of total mass of packaging waste.
In 2007, Slovenia provided recycling for 47% of total mass of packaging waste, thus exceeding the 2007 objective which required 25-45% recycling, In addition, objectives set for 2007 were exceeded for individual materials, but in case of metal packaging waste only by a few percents. The objective for 2012 is set at 55-80 % of recycling. In case of some materials like plastic, paper and cardboard and wood this objective was already exceeded in 2007. We recycled 46.5% of plastic, 68.5% of paper and cardboard, and 21% of wood. Glass recycling amounted to 42% (the 2012 objective is set at 60%), and metals to 21 % (2012 objective: 50%).
In European Union, the quantities of packaging waste per capita are increasing in average, and enormous differences can be notices both by years and between individual countries. In 2007, the 27 EU Member States generated in average 165 kg of packaging waste per capita, while collected quantities vary significantly, ranging between 41 kg per capita in Bulgaria to 245 kg per capita in Ireland. The discrepancy may partly be attributed to differences in methodology. However, increasing quantities of packaging waste are not in accordance with the objectives of the Directive on packaging and packaging waste, which defines the reduction of packaging waste as one of its purposes. Production companies could greatly contribute to the achievement of the set objectives, if they would consider packaging as an integral part of any product development, keeping in mind the goal of packaging waste prevention.
In terms of recovery, the objective applied to the European Union for 2001 amounted to 50% recovery of total mass of packaging waste; by 2006, that objective was achieved by more than a half of EU-27 Member States, and the majority of them even reached the objective of 55% recovery for 2008. By 2006, almost all EU-27 Member States reached the minimum target of 25% recycling of the total mass of packaging waste, of which nearly one half reached the target set for 2008 (55-80%) already in 2006.
Methodology
Data for Slovenia:
Objectives summarized by: Decree on the management of packaging and packaging waste (Official Gazette of the Republic of Slovenia, No. 84/06, 106/06, 110/07) and the Resolution on National Environmental Action Plan 2005-2012 (Official Gazette of the Republic of Slovenia, No. 2/06).
Source database or source: Analysis of waste management annual reports; Waste Management Documents, Environmental Agency of the Republic of Slovenia.
Data administrator: Environmental Agency of the Republic of Slovenia.
Data acquisition date for this indicator: 17 November 2009
Methodology and frequency of data collection for the indicator: Data have been captured for the 2001-2007 period; they are collected annually. Data were submitted pursuant to the Decree on the management of packaging and packaging waste (Official Gazette of the Republic of Slovenia, Nos. 84/06, 106/06 and 110/07) by the liable entities who placed on the market in the Republic of Slovenia above 15,000 kg packaging in total and are obliged at their own cost to provide for collection of their packaging waste. In addition, data on packaging placed on the market, submitted by the Customs Administration of the Republic of Slovenia, as well as data on collected and recovered packaging waste, submitted by the liable entities under the Decree on waste management, were also processed. Data on the size of population of Slovenia in each year, and data on the GDP were obtained from the Statistical Office of the Republic of Slovenia. Data on quantities of packaging waste in the European Union were taken from Eurostat.
Data processing methodology: Graph presentations are based on data about total quantities of packaging waste and quantities of generated and recovered packaging waste in Slovenia (v tonnes). Shares of recovery and recycling for individual materials were calculated with regard to the total recovery and recycling of packaging waste.
Figure OD13-1: The quantity of generated packaging waste per capita in Slovenia and EU is the quantity of generated packaging calculated to the size of population in Slovenia according to the SORS data as at 31 December for each year, and to the size of population in the EU according to the Eurostat data as at 31 December for each year.
Figure OD13-2: Trend in total quantity of packaging waste and GDP shows data converted to the index of the base year 2001.
Information concerning data quality:
- Advantages and disadvantages of the indicator: Packaging waste comprises any packaging placed on the market in Slovenia together with goods, service packaging and disposable packaging placed on the market in Slovenia, and packaging imported by ultimate users. Data on quantities of generated packaging waste are taken under the assumption that the quantity of packaging placed on the market is equal to the quantity of generated packaging waste in the same calendar year (Final report on management of packaging and packaging waste for 2007, 2009).
According to the Decree on the management of packaging and packaging waste (Official Gazette of the Republic of Slovenia, Nos. 84/06, 106/06 and 110/07), the liable entities who place on the market less than 15,000 kg of packaging need not provide for the prescribed management of packaging waste.
The companies Slopak and Interseroh report on the quantity of composite packaging waste, which is not in compliance with Article 4, para 3, of the Decree, which stipulates that composite packaging waste shall be classified by the prevailing type of packaging material, in terms of mass.
- Relevance, accuracy, robustness, uncertainty:
Reliability of the indicator (archival data): /
Uncertainty of the indicator (scenarios/projections): /
- Overall assessment (1 = no major comments, 3 = data to be considered with reservation):
Relevance: 1
Accuracy: 1
Completeness over time: 2
Completeness over space: 2
Other sources and literature:
- EARS, 2009a. Final report on the management of packaging and packaging waste for 2007. Ljubljana, The Ministry of the Environment and Spatial Planning, Environmental Agency of the Republic of Slovenia.
- EARS, 2009b. Manual to the Rules on the management of packaging and packaging waste with instructions for the completion of annual reports on packaging and packaging waste. Ljubljana, The Ministry of the Environment and Spatial Planning, Environmental Agency of the Republic of Slovenia.
- Leban, J., 2009. Gospodarske družbe – med cilji and rezultati pri ravnanju z odpadno embalažo. V: Celovito ravnanje z odpadki – okoljsko ogledalo Slovenije. Celje, Fit media, pp. 50-54
- Šarc, B., 2009. Priprava na nove sheme pri ravnanju z odpadno embalažo in drugimi vrstami odpadkov . V: Celovito ravnanje z odpadki – okoljsko ogledalo Slovenije. Celje, Fit media, pp. 63-66
- EEA, 2009. Generation and recycling of packaging waste (CSI 017) (cited as at 17 November 2009)
- EUROSTAT, 2009. Environmental Data Centre on Waste (cited as at 17 November 2009).


