[VD05] Nitrates in groundwater

Key message

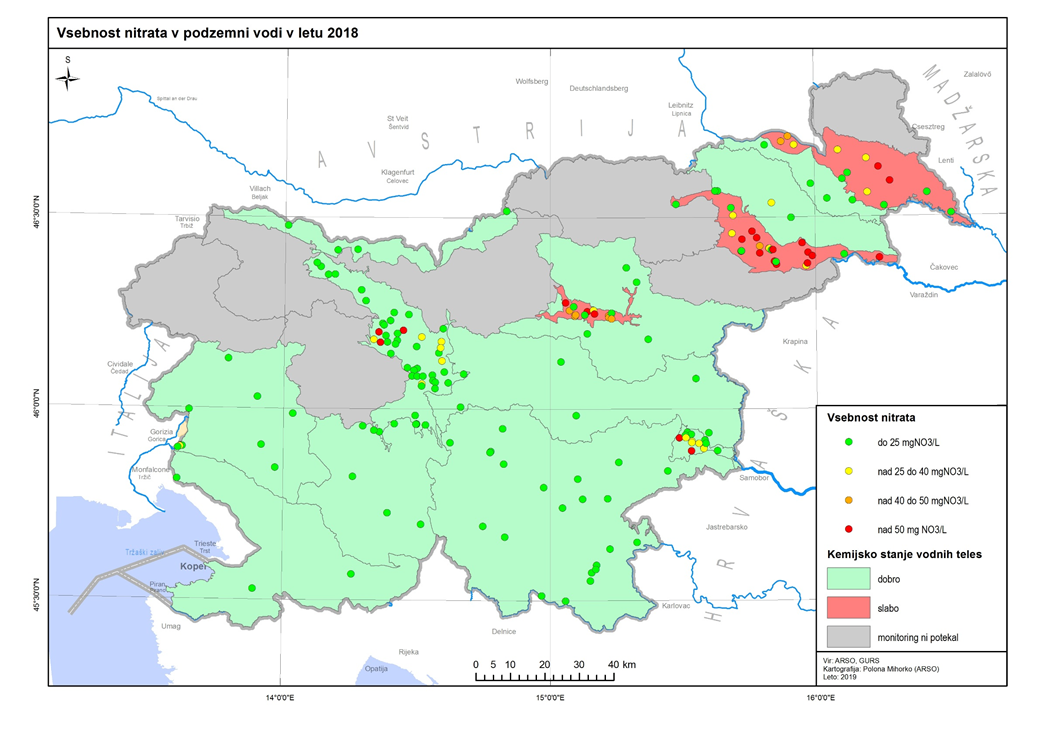
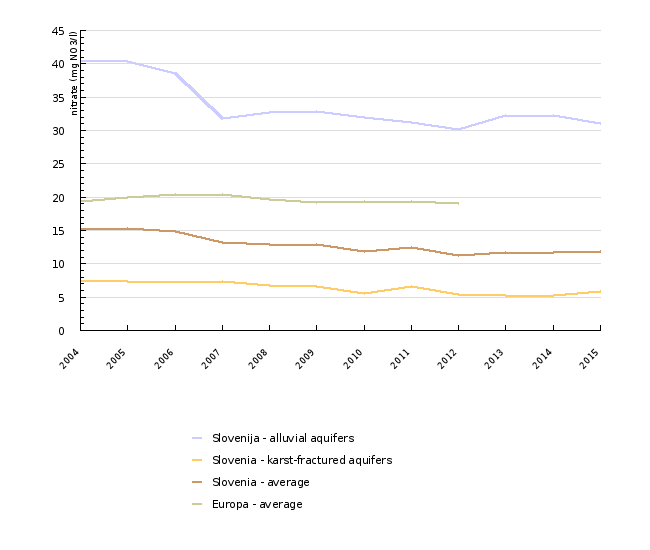
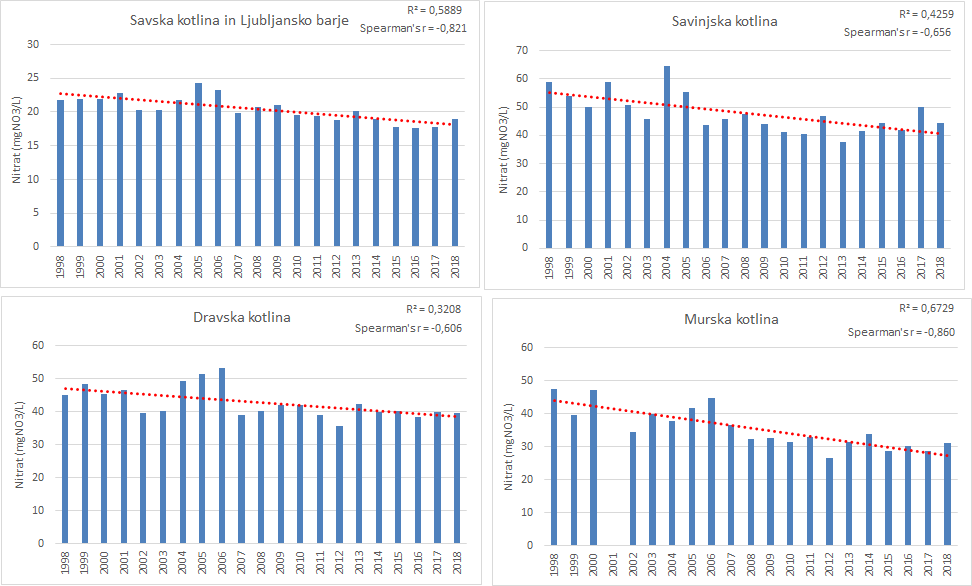
Slovenian groundwater bodies most polluted with nitrates are those with intergranular (alluvium) aquifers, particularly in north-eastern Slovenia. Groundwater in karst and fractured aquifers is less burdened with nitrates due to geographical conditions, low population density and less agricultural land. In the period 1998–2015, the average annual levels of nitrates in water bodies in the Savinja, Drava and Mura basins show a statistically significant downward trend. In other water bodies, declining nitrate levels are not statistically significant.
Definition
This indicator shows the concentration of nitrates in groundwater samples. Mean annual values for individual measuring sites, water bodies in Slovenia and Europe, were calculated.
Nitrates can be naturally present in groundwater. Natural background concentrations of nitrates depend on geological properties of aquifers – in Slovenia, they are below 10 mg NO3/l. Increased concentrations of nitrates in groundwater are a result of human activities, agriculture in particular. Nitrates can also appear in groundwater as a consequence of improper urban wastewater management. In Slovenia, groundwater represents the main source of drinking water.
Charts
Standardised Database for Water Quality Monitoring, Slovenian Environmental Agency, 2015
Standardised Database for Water Quality Monitoring, Environmental Agency of the Republic of Slovenia, 2015; EEA Waterbase_groundwater_v14, 2016
| 2004 | 2005 | 2006 | 2007 | 2008 | 2009 | 2010 | 2011 | 2012 | 2013 | ||
|---|---|---|---|---|---|---|---|---|---|---|---|
| Slovenija - alluvial aquifers | mg/l | 40.6 | 40.3 | 38.6 | 31.8 | 32.8 | 32.9 | 31.9 | 31.2 | 30.2 | 32.3 |
| Slovenia - karst-fractured aquifers | mg/l | 7.5 | 7.4 | 7.4 | 7.3 | 6.8 | 6.6 | 5.5 | 6.6 | 5.4 | 5.3 |
| Slovenia - average | mg/l | 15.4 | 15.2 | 14.8 | 13.1 | 13 | 12.8 | 11.8 | 12.5 | 11.3 | 11.7 |
| Europa - average | mg/l | 19.3 | 19.9 | 20.4 | 20.4 | 19.7 | 19.2 | 19.3 | 19.3 | 19.1 | |
| 2014 | 2015 | ||||||||||
| Slovenija - alluvial aquifers | mg/l | 32.2 | 31.1 | ||||||||
| Slovenia - karst-fractured aquifers | mg/l | 5.3 | 5.8 | ||||||||
| Slovenia - average | mg/l | 11.7 | 11.8 | ||||||||
| Europa - average | mg/l |
Standardised Database for Water Quality Monitoring, Slovenian Environmental Agency, 2016
| 1998 | 1999 | 2000 | 2001 | 2002 | 2003 | 2004 | 2005 | 2006 | 2007 | ||
|---|---|---|---|---|---|---|---|---|---|---|---|
| 1001 Savska kotlina in Ljubljansko barje | mg/l | 23.4 | 22.8 | 21.6 | 21.9 | 20.7 | 20.7 | 20.9 | 22.9 | 22.7 | 18.4 |
| 1002 Savinjska kotlina | mg/l | 50 | 43.8 | 47.2 | 55.5 | 43.9 | 50.5 | 65 | 57.8 | 45.4 | 47.3 |
| 1003 Krška kotlina | mg/l | 21.8 | 23.8 | 20.4 | 25.7 | 33 | 22.3 | 29.4 | 24.8 | 26.9 | 21.1 |
| 3012 Dravska kotlina | mg/l | 45.1 | 48.4 | 45.4 | 46.5 | 39.7 | 40.3 | 49.5 | 54 | 53.3 | 39.1 |
| 4016 Murska kotlina | mg/l | 47.6 | 39.8 | 47.3 | 34.4 | 39.9 | 38 | 42 | 44.7 | 32.9 | |
| quality standard | mg/l | 50 | 50 | 50 | 50 | 50 | 50 | 50 | 50 | 50 | 50 |
| 2008 | 2009 | 2010 | 2011 | 2012 | 2013 | 2014 | 2015 | ||||
| 1001 Savska kotlina in Ljubljansko barje | mg/l | 19.6 | 20.6 | 19.2 | 19.2 | 18.2 | 18.9 | 18.8 | 18 | ||
| 1002 Savinjska kotlina | mg/l | 48.7 | 44.8 | 42.5 | 43.2 | 46.9 | 40.2 | 44 | 44.7 | ||
| 1003 Krška kotlina | mg/l | 23.2 | 24.2 | 24.1 | 21.6 | 23.7 | 28.7 | 24.5 | 23.6 | ||
| 3012 Dravska kotlina | mg/l | 40.3 | 42.1 | 42.2 | 39 | 35.6 | 42.3 | 40 | 40.3 | ||
| 4016 Murska kotlina | mg/l | 32.2 | 32.6 | 31.8 | 32.9 | 26.7 | 31.4 | 33.7 | 28.7 | ||
| quality standard | mg/l | 50 | 50 | 50 | 50 | 50 | 50 | 50 | 50 |
Standardised Database for Water Quality Monitoring, Slovenian Environmental Agency, 2016
| 1998 | 1999 | 2000 | 2001 | 2002 | 2003 | 2004 | 2005 | 2006 | 2007 | ||
|---|---|---|---|---|---|---|---|---|---|---|---|
| Lipovci | mg/l | 127.3 | 120.3 | 128.6 | 105.9 | 95.2 | 94.5 | 100 | 110.3 | 92.8 | |
| Lancova vas | mg/l | 76.2 | 73 | 81.1 | 85.3 | 82 | 79.7 | 87.1 | 93 | 94.5 | 86.5 |
| Šempeter | mg/l | 97 | 84.2 | 77.6 | 106.1 | 99.7 | 95.2 | 125.5 | 95.5 | 74 | 75.3 |
| Godešič | mg/l | 58.5 | 64.4 | 67.2 | 76.9 | 62 | 59.8 | 59.1 | 67.8 | 66.3 | 60.7 |
| quality standard | mg/l | 50 | 50 | 50 | 50 | 50 | 50 | 50 | 50 | 50 | 50 |
| 2008 | 2009 | 2010 | 2011 | 2012 | 2013 | 2014 | 2015 | ||||
| Lipovci | mg/l | 86.5 | 82 | 73 | 91 | 80 | 45.5 | 59 | 73 | ||
| Lancova vas | mg/l | 91 | 88.5 | 77.5 | 82 | 77.5 | 75.5 | 75.5 | 62 | ||
| Šempeter | mg/l | 88.5 | 75 | 62 | 64.5 | 73 | 73.5 | 69 | 62 | ||
| Godešič | mg/l | 68.3 | 63.7 | 64.2 | 67.3 | 73.3 | 58 | 55.5 | 55.5 | ||
| quality standard | mg/l | 50 | 50 | 50 | 50 | 50 | 50 | 50 | 50 |
Standardised Database for Water Quality Monitoring, Slovenian Water Agency, 2015
Goals
- To improve the state of the water environment
- To reduce emissions from dispersed sources (intensive agriculture, dispersed settlement without wastewater treatment)
- To achieve a favourable state of groundwater by 2015
- To reduce concentrations of nitrates in overburdened groundwater below 50 mg NO3/l and to reverse the trends of increasing nitrate concentrations
Comment
Slovenia is divided into 21 groundwater bodies. In 2015, monitoring of groundwater quality was carried out in Slovenia. 194 gauging stations distributed across 14 water bodies were included in the monitoring. In 2014 and 2015, the monitoring network was upgraded with new gauging stations built under the BOBER project. The stations were built on water bodies exposed to higher levels of pollution. The monitoring programme included water bodies with the highest concentrations of nitrates in intergranular aquifers and karst/fractured water bodies where large drinking water wells are located and where, based on pressure analyses, pollution of drinking water sources may occur.
In Slovenia, average concentrations of nitrates in groundwater are below the European average.
Due to geographical conditions, lower population density and smaller areas of cultivated land, groundwater in karst and fractured aquifers is less contaminated with nitrates than groundwater in intergranular aquifers. This was confirmed by the results of national monitoring in 2015. In the majority of groundwater bodies with predominantly karstic and fractured aquifers, mean annual concentrations of nitrates were below 10 mg NO3/l and never exceeded 25 mg NO3/l.
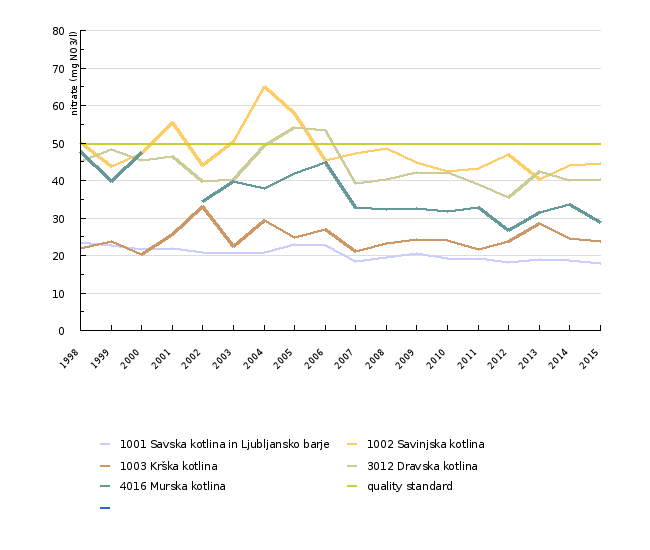
Agriculture predominates in the north-eastern and central parts of Slovenia, in the lower, flat sections of river valleys (Drava, Mura, Savinja, Sava) with prevailing intergranular porosity aquifers (alluvial aquifers). This is reflected in higher concentrations of nitrates in groundwater, which are higher than natural background concentrations and exceed the 50 mg NO3/l standard at many gauging stations. Water bodies in the Savinja, Drava and Mura water basins are the most burdened with nitrates. However, mean annual nitrate values in these water bodies have not exceeded the quality standard since 2007.
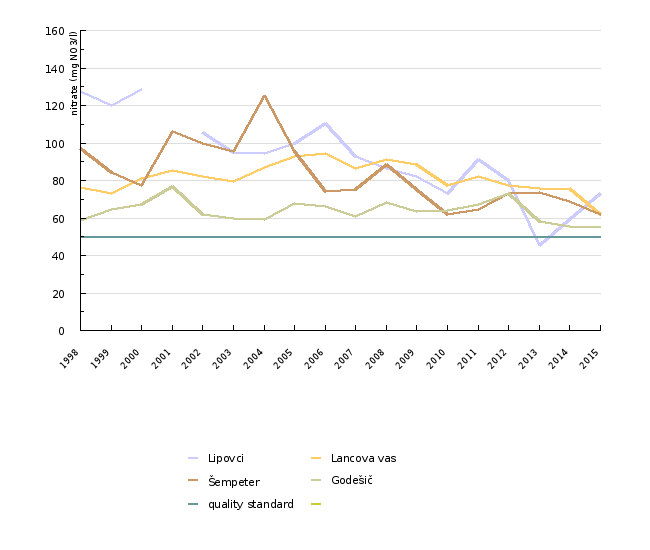
For each groundwater body in which areas of excessive concentrations of nitrates have been known to occur, the most contaminated gauging station is presented with a longer time series of data (VD05-4). Among selected gauging stations within individual groundwater bodies that are the most contaminated with nitrates, a statistically significant downward trend has been observed in Lipovci and Šempeter, while the other two stations have only observed annual fluctuation of this parameter.
In the period 1998–2015, mean annual levels of nitrates in water bodies with alluvial aquifers that are the most contaminated with nitrates show a statistically significant downward trend in the Savinja, Drava and Mura basins (VD05-5). In other water bodies, declining nitrate levels are not statistically significant. Thus, at least in some water bodies, the results of national groundwater monitoring can confirm positive effects that are likely the result of measures to reduce nitrogen loading to soils.


