[EN10] Final energy consumption by sector

Key message

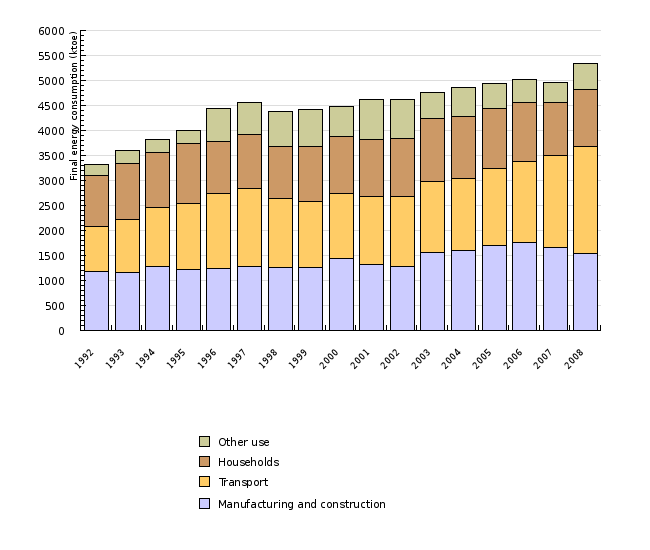
After decreasing in 2007, final energy consumption again substantially increased in 2008. This increase was due to growth in transport and wider use, while final energy consumption in industry decreased. The largest share in final energy consumption pertains o transport followed by industry, households and other use.
Definition
This indicator shows final energy consumption that is defined as the sum of final energy consumption of all sectors – manufacturing and construction, transport and wider use, which includes household use, services and agriculture.
Final energy consumption is measured in thousand tonnes of oil equivalent (ktoe). The conversion from mass units is conducted using calorific values of individual types of fuel.
The indicator can be presented in relative (the relative contribution of a specific sector to total final energy consumption) or absolute terms. For absolute values, thousand tonnes of oil equivalent (ktoe) are used.
Charts
Statistical Office of the Republic of Slovenia, 2009; Jožef Stefan Institute, 2009.
| 1992 | 1993 | 1994 | 1995 | 1996 | 1997 | 1998 | 1999 | 2000 | 2001 | ||
|---|---|---|---|---|---|---|---|---|---|---|---|
| Manufacturing and construction | ktoe | 1187 | 1156 | 1272 | 1225 | 1242 | 1280 | 1260 | 1259 | 1433 | 1328 |
| Transport | ktoe | 885 | 1067 | 1189 | 1325 | 1494 | 1562 | 1378 | 1312 | 1314 | 1360 |
| Households | ktoe | 1025 | 1118 | 1109 | 1188 | 1050 | 1075 | 1041 | 1109 | 1139 | 1137 |
| Other use | ktoe | 231 | 268 | 242 | 257 | 646 | 645 | 707 | 742 | 603 | 792 |
| Final energy consumption - Slovenia | ktoe | 3327 | 3609 | 3812 | 3995 | 4431 | 4561 | 4386 | 4423 | 4489 | 4617 |
| Final energy consumption - EU-27 | ktoe | 1047515 | 1053276 | 1049244 | 1071341 | 1115793 | 1104279 | 1111180 | 1109214 | 1114360 | 1140322 |
| Final energy consumption - EU-15 | ktoe | 878046 | 884906 | 882722 | 901451 | 938654 | 931462 | 947527 | 953011 | 962085 | 984753 |
| Final energy consumption - EU-10 | ktoe | 134454 | 135296 | 130658 | 131713 | 135939 | 134795 | 127566 | 124951 | 121162 | 123903 |
| 2002 | 2003 | 2004 | 2005 | 2006 | 2007 | 2008 | |||||
| Manufacturing and construction | ktoe | 1286 | 1570 | 1593 | 1705 | 1761 | 1665 | 1537 | |||
| Transport | ktoe | 1387 | 1405 | 1452 | 1543 | 1626 | 1834 | 2152 | |||
| Households | ktoe | 1171 | 1259 | 1242 | 1197 | 1167 | 1058 | 1126 | |||
| Other use | ktoe | 777 | 523 | 571 | 497 | 460 | 397 | 518 | |||
| Final energy consumption - Slovenia | ktoe | 4621 | 4757 | 4858 | 4942 | 5014 | 4954 | 5333 | |||
| Final energy consumption - EU-27 | ktoe | 1126807 | 1159718 | 1173009 | 1172258 | 1175579 | 1157654 | ||||
| Final energy consumption - EU-15 | ktoe | 972202 | 998480 | 1008237 | 1007045 | 1006008 | 989867 | ||||
| Final energy consumption - EU-10 | ktoe | 122813 | 127619 | 130047 | 130954 | 134790 | 133983 |
Statistical Office of the Republic of Slovenia, 2009; Jožef Stefan Institute, 2009.
| 1992 | 2000 | 2005 | 2008 | ||
|---|---|---|---|---|---|
| Final energy consumption | ktoe | 3327 | 4489 | 4942 | 5333 |
| Manufacturing and construction | ktoe | 1187 | 1433 | 1705 | 1537 |
| Transport | ktoe | 885 | 1314 | 1543 | 2152 |
| Households | ktoe | 1025 | 1139 | 1197 | 1126 |
| Other use | ktoe | 231 | 603 | 497 | 518 |
| Final energy consumption | % | 100 | 100 | 100 | 100 |
| Manufacturing and construction | % | 36 | 32 | 35 | 29 |
| Transport | % | 27 | 29 | 31 | 40 |
| Households | % | 31 | 26 | 24 | 21 |
| Other use | % | 7 | 14 | 10 | 10 |
Statistical Office of the Republic of Slovenia, 2009; Jožef Stefan Institute, 2009.
| Other use | Households | Transport | Manufacturing and construction | ||
|---|---|---|---|---|---|
| 2007-2008 | % | 30.4 | 6.5 | 17.3 | -7.7 |
| 2006-2007 | % | -13.7 | -9.3 | 12.8 | -5.5 |
| 2000-2008 | % | -1.9 | -0.1 | 6.4 | 0.9 |
| 1992-2008 | % | 5.2 | 0.6 | 5.7 | 1.6 |
Eurostat, 2009.
| 1992-2007 | 2000-2007 | 2005-2006 | 2006-2007 | ||
|---|---|---|---|---|---|
| EU-27 | % | 0.7 | 0.5 | 0.3 | -1.5 |
| EU-15 | % | 0.8 | 0.4 | -0.1 | -1.6 |
| EU-10 | % | 0 | 1.4 | 2.9 | -0.6 |
| Slovenia | % | 2.6 | 1.3 | 1.1 | -1.4 |
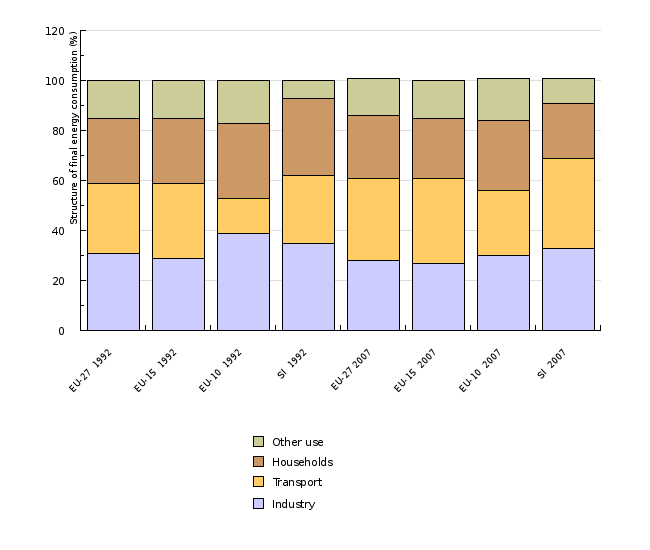
Eurostat, 2009.
| EU-27 1992 | EU-15 1992 | EU-10 1992 | SI 1992 | EU-27 2007 | EU-15 2007 | EU-10 2007 | SI 2007 | ||
|---|---|---|---|---|---|---|---|---|---|
| Industry | % | 31 | 29 | 39 | 35 | 28 | 27 | 30 | 33 |
| Transport | % | 28 | 30 | 14 | 27 | 33 | 34 | 26 | 36 |
| Households | % | 26 | 26 | 30 | 31 | 25 | 24 | 28 | 22 |
| Other use | % | 15 | 15 | 17 | 7 | 15 | 15 | 17 | 10 |
| Industry | ktoe | 321422 | 252796 | 51966 | 1151 | 322846 | 270112 | 39750 | 1602 |
| Transport | ktoe | 290589 | 265672 | 19098 | 887 | 377249 | 334827 | 35068 | 1754 |
| Households | ktoe | 277525 | 228730 | 40143 | 1021 | 284553 | 238026 | 36949 | 1048 |
| Other use | ktoe | 157980 | 130848 | 23247 | 233 | 173006 | 146902 | 22217 | 469 |
| Final energy consumption | ktoe | 1047516 | 878046 | 134454 | 3292 | 1157654 | 989867 | 133984 | 4873 |
Goals
- the trend in final energy consumption should enable the 8 % reduction in greenhouse gas emissions objective to be met;
- the implementation of measures aimed at facilitating efficient use should result in saving 9 % of total energy consumption by 2016;
- a 25 % use of renewable energy sources in final energy consumption by 2020.
Comment
The trend in final energy consumption by sector provides a broad indication of progress made in reducing energy consumption and in implementing policies that influence energy efficiency. Final fossil energy consumption has a direct impact on emissions of air pollutants and greenhouse gas emissions. The reduction of final energy consumption is important both in the context of enhancing the security of energy supply and increasing the economy’s competitiveness as well as of reducing environmental impacts by reducing emissions of air pollutants and greenhouse gas emissions.
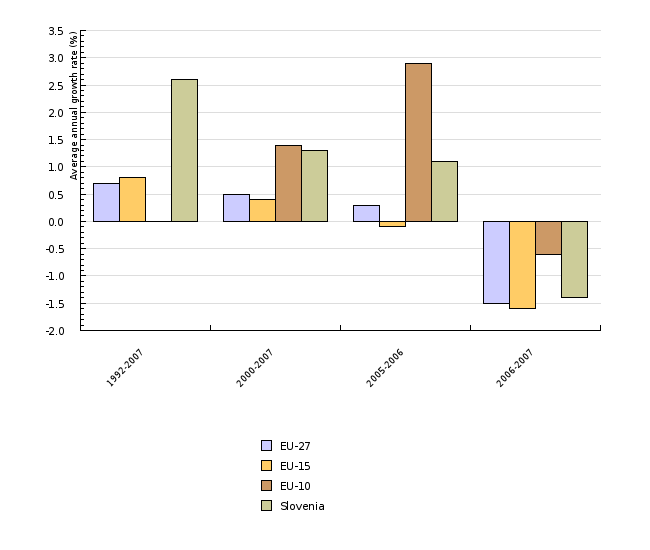
In 2008, final energy consumption amounted to 5333 ktoe, which is substantially more than in 2007 when it stood at 4954 ktoe. In the 1992-2008 period, final energy consumption increased by 60 %, whereby the majority of this growth took place by the year 1997. In 1998, final energy consumption decreased, especially due to lower sales of motor fuels to non-nationals. By the year 2000, annual growth stood at slightly over 1 %. In the 2000-2006 period, we recorded annual growth of slightly under 2 %. In 2007, final energy consumption decreased for the first time since 1998, but in 2008, growth was so high (almost 8 %) that this reduction is not evident in total consumption (average annual growth rate of 3.1 % in the 2007-2008 period).
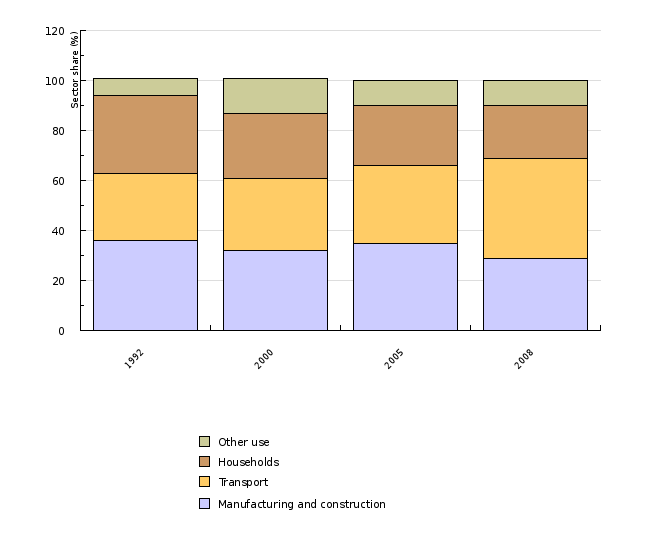
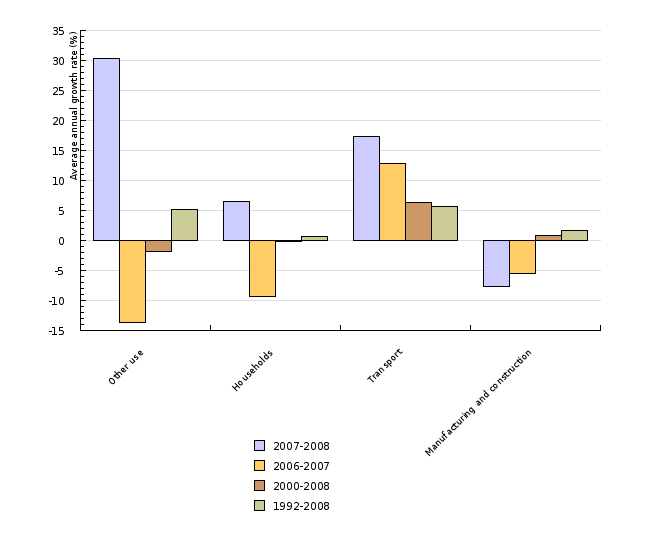
The fastest growing sector was transport, where 143 % more energy was consumed in 2008 compared to 1992. The first peak was reached in 1997 due to fuel tourism. After corresponding measures were implemented by neighbouring countries, this consumption started to drop by 1999. In the 2000-2008 period, we recorded an average annual growth of 6.4 %. Energy consumption intensively grew in 2007 (12.8 %) and 2008 (17.3 %). In 2007, growth equalled the highest growth of the 1994-2008 period and in 2008, a new highest growth level was recorded. The high growth of total energy consumption in transport has resulted from increased ownership of private cars, a higher number of covered kilometres per vehicle and, since Slovenia's EU accession, the main reason for a higher consumption of liquid fuels is the increase in transit transport (Božičnik, 2006). In 2007, transport held the largest share in final energy consumption (37 %) and in 2008, it strengthened its lead holding a 40 % share. In 1992, transport was the third sector by share (Figure 1).
In 2008, total energy consumption of the other use sector was 124 % higher than in 1992. The largest increase happened in 1996, when consumption increased by 180 %. After a reduction in the 2005-2007 period, consumption again increased by slightly more than 30 % in 2008. This highly chequered trend is due to the manner in which energy consumption in this sector is determined. It is calculated as the difference between total final energy consumption and final energy consumption in the manufacturing and construction, transport and households sectors.
In 2007, following years of growth, energy consumption in manufacturing and construction decreased for the first time since 2002 (by slightly more than 5 %). This reduction continued in 2008 with an annual rate of slightly under 8 %. This reduction was due to a lower intensity of energy consumption, as added value increased. In 2008, consumption was 30 % higher than in 1992. With 29 %, manufacturing and construction held the second largest share in total final energy consumption.
After increasing since 1998, final energy consumption in households decreased in the 2004-2007 period. Another increase was again recorded in 2008. After slightly more than a 9 % reduction in 2007, consumption again increased by slightly more than 6 % in 2008. Looking at this two-year average, consumption decreased by a little less then 2 % annually. Compared to 1992, consumption was 10 % higher in 2008 and 1 % lower compared to the year 2000. The increase in final energy consumption is due to the purchase of liquid fuels being postponed from 2007 to 2008 due to growing prices and a colder year in 2008. A major uncertainty is the poor statistical monitoring of wood biomass consumption in households, as it has remained constant since 2002. This means that statistics do not record transitions between fossil fuels (especially fuel oil) and wood, which is undoubtedly strongly influenced by prices of liquid fuel.
In the future, the implementation of measures as determined by the Action Plan for Energy Efficiency will have to lead to reductions in final energy consumption, or the target share of renewable energy sources will not be achieved in 2020. These endeavours urgently need to be facilitated in the public sector and in buildings where there is still great potential to increase energy efficiency.
By comparing the structure of final energy consumption in Slovenia with that of the EU-15 average, it is clear that Slovenia had a larger share of manufacturing and transport and a smaller share of wider use (households and other use) in 2007.
Final energy consumption was influenced by a wide range of policies united under the umbrella name of measures for increasing energy efficiency. In Slovenia, these measures are determined by the Resolution on the National Energy Programme and due to their impact on greenhouse gas emissions also by the Operational Programme for Limiting Greenhouse Gas Emissions by 2012. In 2008 (31 January), the first of three energy efficiency action plans was adopted in the framework of implementing the Directive on Energy End-Use Efficiency and Energy Services (2006/32/EC). The action plan includes a package of measures aimed at achieving a more efficient use of energy in all sectors of final consumption, with emphasis on the public sector which needs to act as an example. Energy savings arising from the implementation of these measures in the 2008-2016 period are estimated at 4261 GWh. The mentioned directive requires actions to be undertaken by the Member States to achieve an energy savings target of 9 % for the ninth year of application of this Directive (from 1 January 2008). The target set by the Action Plan for Energy Efficiency (COM 2006(545)) and the Climate and Energy Package and which is to be met by 2020 foresees a 20 % reduction in energy consumption.
Methodology
Data for Slovenia and other countries
Objectives summarised by: Resolucija o Nacionalnem programu varstva okolja 2005-2012 (Resolution on the National Environmental Action Plan 2005-2012, Official Gazette of the Republic of Slovenia, No. 2/06), Nacionalni akcijski načrt za energetsko učinkovitost za obdobje 2008–2016 (National Energy Efficiency Action Plan for the 2008-2016 period) and the proposal of the climate and energy package.
Source database or source: Joint questionnaire, SI-STAT and EUROSTAT online application.
Data administrator: The Statistical Office of the Republic of Slovenia and EUROSTAT.
Date of acquisition for the indicator: 26 November 2009
Methodology and frequency of data collection: Data are prepared on an annual basis. Data for the previous year are available at the end of the current year. Data for the 1992-1999 period were calculated on the basis of data on fuel consumption in mass units that were submitted to EUROSTAT by the Statistical Office of the Republic of Slovenia (Joint Annual Questionnaire) and data on calorific values for individual types of fuels that were obtained by the Joint Annual Questionnaire (solid and gaseous fuels) and the SI-STA online application of the Statistical Office (liquid fuels). As regards data following the year 2000, data as published on the website of the Statistical Office and on the SI-STAT Data Portal (published on 25 September 2009) were used. Final energy consumption used in this indicator differs from final energy consumption as published by the Statistical Office of the Republic of Slovenia in the energy balance. The difference is the result of the Statistical Office of the Republic of Slovenia considering energy-related and non-energy related final energy consumption, while EUROSTAT does not. For the indicator, EUROSTAT’s definition of final energy consumption has been used. In order to ensure data comparability between Slovenia and the EU, EUROSTAT’s data were used for both the EU and Slovenia, as EUROSTAT uses different calorific values. Data were obtained from EUROSTAT’s website under Environment and Energy.
The different calorific values used are the reason for differences between the energy statistics of the Slovenian Statistical Office and EUROSTAT. The Slovenian Statistical Office uses national calorific values, while EUROSTAT uses average calorific values for Europe.
Data processing methodology: Average annual rate of growth is calculated using [(last year/base year) ^ (1/number of years) –1] x 100.
For calculating shares of individual sectors in total final energy consumption, total final energy consumption was the denominator and final energy consumption of an individual sector was the numerator.
Geographical coverage: The EU-27 countries are EU Member States: Austria, Belgium, Bulgaria, Cyprus, the Czech Republic, Denmark, Estonia, Finland, France, Germany, Greece, Hungary, Ireland, Italy, Latvia, Lithuania, Luxembourg, Malta, the Netherlands, Poland, Portugal, Romania, Slovakia, Slovenia, Spain, Sweden and the United Kingdom. The EU-10 countries are Member States that acceded to the EU in 2004 (Cyprus, the Czech Republic, Estonia, Hungary, Latvia, Lithuania, Malta, Poland, Slovakia and Slovenia).
Information concerning data quality:
- Advantages and disadvantages of the indicator: The source of basic data is one institution (the Statistical Office of the Republic of Slovenia, EUROSTAT) for the entire time frame. This enables a higher quality analysis of events in the treated period.
- Relevance, accuracy, robustness, uncertainty:
Reliability of the indicator (archival data): Data reliability is estimated according to the extent of statistical differences in the energy balance that occur due to the use of different calorific values. EUROSTAT uses the criterion that the energy balance is solid if the statistical difference is less than 5 % of energy consumption at the level of the entire state. The statistical difference for the used data amounts to 2.5 % at the beginning of the period, to around 1 % until 1999, while after this year it was less than one percent. Data uncertainty exists as regards comparability over time, especially for sector-related data. There is no official data for the 1992-1999 period that would be comparable to data for the period following the year 2000. In trying to come as close to this consistency as possible, data were calculated from data as provided to EUROSTAT by the Statistical Office. Even though data from the same institution were used, there were discrepancies when comparing calculations and official energy balances for the 2000-2007 period, especially as regards final energy consumption by sector.
Uncertainty of the indicator (scenarios/projections): scenarios and projections are not available.
- Overall assessment (1 = no major comments, 2 = data to be considered with reservation):
Relevance: 1
Accuracy: 2
Completeness over time: 2
Completeness over space: 1
Other sources and literature:
- Božičnik, 2006. Analiza tranzitnega prometa skozi Republiko Slovenijo in ocena možnih prometno političnih ukrepov za zmanjšanje le tega (Analysis of Transit Traffic through the Republic of Slovenia and an Evaluation of Possible Measures for its Curtailment). Božičnik S., Letnik T., Cvahte J., University of Maribor, Faculty of Civil Engineering, Final report. The contracting entity: Ministry of the Environment and Spatial Planning. October 2006.
- European Commission, 2006. COMMUNICATION FROM THE COMMISSION – Action Plan for Energy Efficiency: Realising the Potential (COM(2006)545)
- Ministry of the Economy, 2004. Resolucija o Nacionalnem energetskem programu (Resolution on the National Energy Programme, Official Gazette of the Republic of Slovenia, No. 57/04)


