[EN15] Final energy consumption intensity

Key message

According to the indicator of the intensity of final energy consumption, Slovenia is much below the EU-27 average. After an increase in 2008 followed the decrease in 2009 and 2011, with an intensity increased again in 2010. It decreased only in industry, while in other sectors it increased.
Definition
The indicator final energy consumption is calculated as a ratio between final energy consumption and generated gross domestic product (GDP). The indicator of energy intensity shows how efficiently the Slovenian economy uses energy in creating production units. It is indicated in thousand tonnes of oil equivalent (ktoe) per million EUR (mio €), which are expressed in fixed prices of the previous year, with the reference year being 2000 and the EUR/SIT exchange rate from 2000.
Final energy consumption is defined as the sum of energy in the final consumption sector – processing activities and construction, transport and wider consumption, including households, services and agriculture.
Gross domestic product is defined as the market value of all final products and services generated by the Slovenian economy in one year.
Charts
Jozef Stefan Institute, 2012.
| 1992 | 1993 | 1994 | 1995 | 1996 | 1997 | 1998 | 1999 | 2000 | 2001 | ||
|---|---|---|---|---|---|---|---|---|---|---|---|
| Final energy consumption | [ktoe] | 3278.7 | 3560.8 | 3759.2 | 3942.5 | 4371.3 | 4493.7 | 4317.5 | 4354.5 | 4427.1 | 4550.1 |
| GDP | [mio EUR 2005] | 17241 | 17731.2 | 18675.9 | 19442.9 | 20152.2 | 21151.2 | 21894.7 | 23060.6 | 24044.4 | 24751.1 |
| Final energy intensity | [toe/mio EUR 2005] | 190.2 | 200.8 | 201.3 | 202.8 | 216.9 | 212.5 | 197.2 | 188.8 | 184.1 | 183.8 |
| Final energy consumption | 1992=100 | 100 | 108.6 | 114.7 | 120.2 | 133.3 | 137.1 | 131.7 | 132.8 | 135 | 138.8 |
| GDP | 1992=100 | 100 | 102.8 | 108.3 | 112.8 | 116.9 | 122.7 | 127 | 133.8 | 139.5 | 143.6 |
| Final energy intensity | 1992=100 | 100 | 105.6 | 105.8 | 106.6 | 114.1 | 111.7 | 103.7 | 99.3 | 96.8 | 96.7 |
| 2002 | 2003 | 2004 | 2005 | 2006 | 2007 | 2008 | 2009 | 2010 | 2011 | ||
| Final energy consumption | [ktoe] | 4555.1 | 4686.9 | 4782.9 | 4870.1 | 4939.8 | 4882.7 | 5266.7 | 4815.4 | 4935.6 | 4944.9 |
| GDP | [mio EUR 2005] | 25698.4 | 26451.3 | 27615.6 | 28722.3 | 30402.4 | 32518.5 | 33618.7 | 30982.8 | 31366.9 | 31554.9 |
| Final energy intensity | [toe/mio EUR 2005] | 177.3 | 177.2 | 173.2 | 169.6 | 162.5 | 150.2 | 156.7 | 155.4 | 157.4 | 156.7 |
| Final energy consumption | 1992=100 | 138.9 | 142.9 | 145.9 | 148.5 | 150.7 | 148.9 | 160.6 | 146.9 | 150.5 | 150.8 |
| GDP | 1992=100 | 149.1 | 153.4 | 160.2 | 166.6 | 176.3 | 188.6 | 195 | 179.7 | 181.9 | 183 |
| Final energy intensity | 1992=100 | 93.2 | 93.2 | 91.1 | 89.2 | 85.4 | 79 | 82.4 | 81.7 | 82.7 | 82.4 |
Jožef Stefan Institute, 2012.
| 1992 | 1993 | 1994 | 1995 | 1996 | 1997 | 1998 | 1999 | 2000 | 2001 | ||
|---|---|---|---|---|---|---|---|---|---|---|---|
| Energy intensity | toe/mio € 2005 | 190 | 201 | 201 | 203 | 217 | 212 | 197 | 189 | 184 | 184 |
| Industry and construction | toe/mio € 2005 | 219 | 220 | 229 | 213 | 204 | 197 | 190 | 182 | 198 | 177 |
| Transport | toe/mio € 2005 | 51 | 60 | 64 | 68 | 74 | 74 | 63 | 57 | 54 | 55 |
| Households | toe/mio € 2005 | 512 | 560 | 555 | 594 | 526 | 539 | 523 | 554 | 565 | 567 |
| Services and agriculture | toe/mio € 2005 | 23 | 26 | 22 | 22 | 54 | 51 | 54 | 55 | 43 | 54 |
| Energy intensity | Index (1992 = 100) | 100 | 106 | 106 | 107 | 114 | 112 | 104 | 99 | 97 | 97 |
| Industry and construction | Index (1992 = 100) | 100 | 101 | 105 | 97 | 93 | 90 | 87 | 83 | 91 | 81 |
| Transport | Index (1992 = 100) | 100 | 117 | 124 | 133 | 144 | 144 | 123 | 111 | 106 | 107 |
| Households | Index (1992 = 100) | 100 | 109 | 109 | 116 | 103 | 105 | 102 | 108 | 110 | 111 |
| Services and agriculture | Index (1992 = 100) | 100 | 111 | 95 | 94 | 231 | 221 | 235 | 235 | 184 | 232 |
| 2002 | 2003 | 2004 | 2005 | 2006 | 2007 | 2008 | 2009 | 2010 | 2011 | ||
| Energy intensity | toe/mio € 2005 | 177 | 177 | 173 | 170 | 162 | 150 | 157 | 155 | 157 | 157 |
| Industry and construction | toe/mio € 2005 | 164 | 192 | 187 | 194 | 184 | 159 | 144 | 139 | 145 | 140 |
| Transport | toe/mio € 2005 | 54 | 53 | 53 | 54 | 54 | 56 | 64 | 60 | 59 | 63 |
| Households | toe/mio € 2005 | 583 | 626 | 617 | 592 | 576 | 517 | 549 | 594 | 616 | 571 |
| Services and agriculture | toe/mio € 2005 | 51 | 34 | 35 | 30 | 26 | 21 | 27 | 28 | 29 | 29 |
| Energy intensity | Index (1992 = 100) | 93 | 93 | 91 | 89 | 85 | 79 | 82 | 82 | 83 | 82 |
| Industry and construction | Index (1992 = 100) | 75 | 88 | 86 | 89 | 84 | 72 | 66 | 64 | 66 | 64 |
| Transport | Index (1992 = 100) | 105 | 103 | 102 | 105 | 104 | 110 | 124 | 117 | 115 | 123 |
| Households | Index (1992 = 100) | 114 | 122 | 121 | 116 | 113 | 101 | 107 | 116 | 120 | 112 |
| Services and agriculture | Index (1992 = 100) | 219 | 145 | 151 | 127 | 113 | 91 | 117 | 121 | 124 | 126 |
Jozef Stefan Institute, 2012; Statistical Office of the RS, 2012.
| 2000 | 2001 | 2002 | 2003 | 2004 | 2005 | 2006 | 2007 | 2008 | 2009 | ||
|---|---|---|---|---|---|---|---|---|---|---|---|
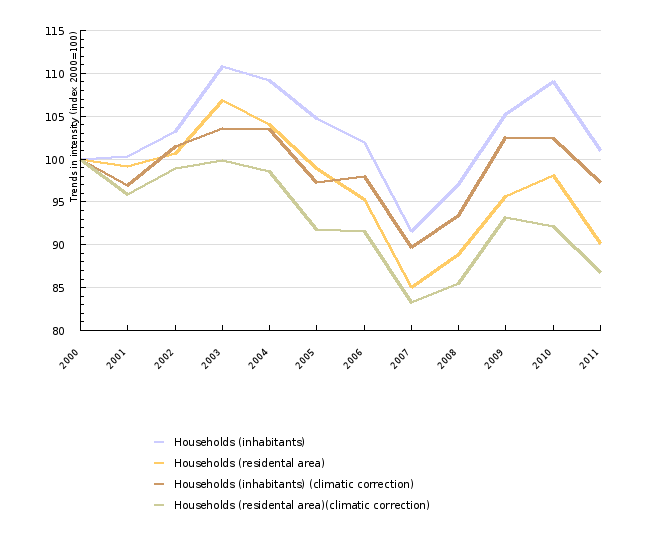
| Households (inhabitants) | Index (2000=100) | 100 | 100.3 | 103.2 | 110.8 | 109.1 | 104.7 | 101.9 | 91.5 | 97.1 | 105.2 |
| Households (residental area) | Index (2000=100) | 100 | 99.2 | 100.7 | 106.8 | 104 | 98.8 | 95.3 | 85 | 88.9 | 95.6 |
| Households (inhabitants) (climatic correction) | Index (2000=100) | 100 | 96.9 | 101.4 | 103.5 | 103.4 | 97.3 | 98 | 89.7 | 93.4 | 102.5 |
| Households (residental area)(climatic correction) | Index (2000=100) | 100 | 95.8 | 98.9 | 99.9 | 98.6 | 91.8 | 91.6 | 83.2 | 85.5 | 93.2 |
| 2010 | 2011 | ||||||||||
| Households (inhabitants) | Index (2000=100) | 109 | 101 | ||||||||
| Households (residental area) | Index (2000=100) | 98.1 | 90.1 | ||||||||
| Households (inhabitants) (climatic correction) | Index (2000=100) | 102.5 | 97.2 | ||||||||
| Households (residental area)(climatic correction) | Index (2000=100) | 92.1 | 86.8 |
Statistical Office of the RS, 2012; Jožef Stefan Institute, 2012.
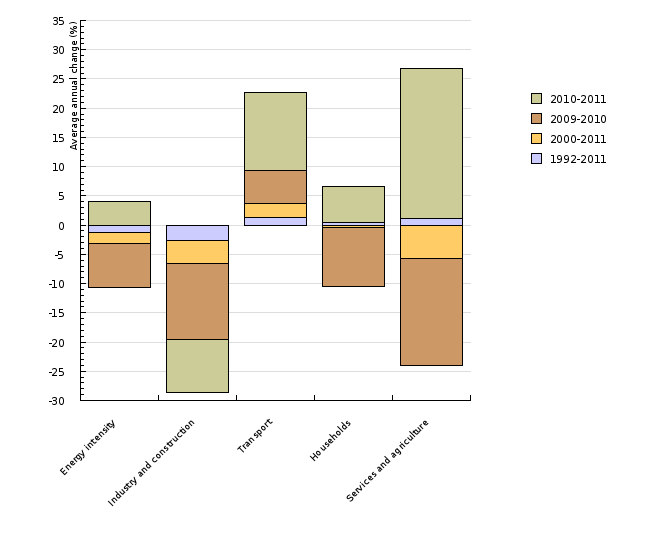
| Energy intensity | Industry and construction | Transport | Households | Services and agriculture | ||
|---|---|---|---|---|---|---|
| 1992-2011 | %/year | -1.2 | -2.6 | 1.4 | 0.5 | 1.2 |
| 2000-2011 | %/year | -1.9 | -3.9 | 2.3 | -0.4 | -5.7 |
| 2009-2010 | %/year | -7.5 | -13.1 | 5.6 | -10 | -18.3 |
| 2010-2011 | %/year | 4 | -9.1 | 13.4 | 6.1 | 25.7 |
Eurostat, 2012
| 2000 | 2010 | ||
|---|---|---|---|
| EU-27 | toe/mio EUR 2005 | 111.2 | 99.6 |
| SI | toe/mio EUR 2005 | 184.1 | 157.4 |
Goals
Slovenian energy policy stipulates a decrease in the economy's energy intensity; however, it does not stipulate specific objectives and mechanisms for the improvement of energy intensity. Specific objectives are defined only for energy efficiency, which is an important factor for the economy's energy intensity:
- 9 % savings of final energy in 2008-2016, in the area of final energy efficiency;
- savings of up to 20 % of energy until 2020.


