[EN15] Final energy consumption intensity

Key message

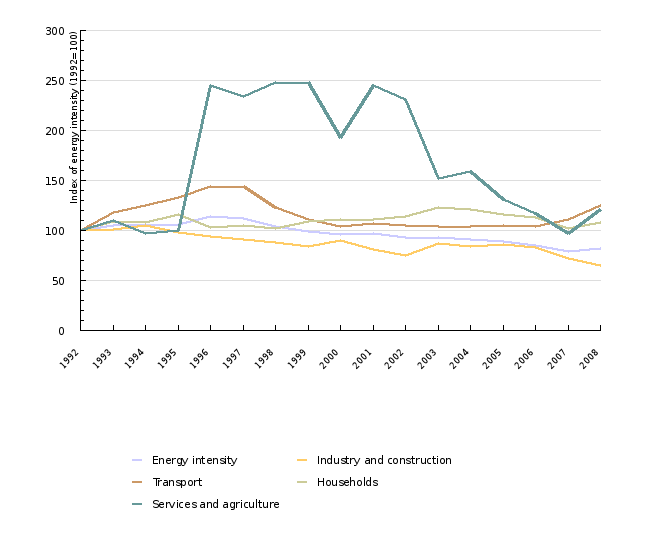
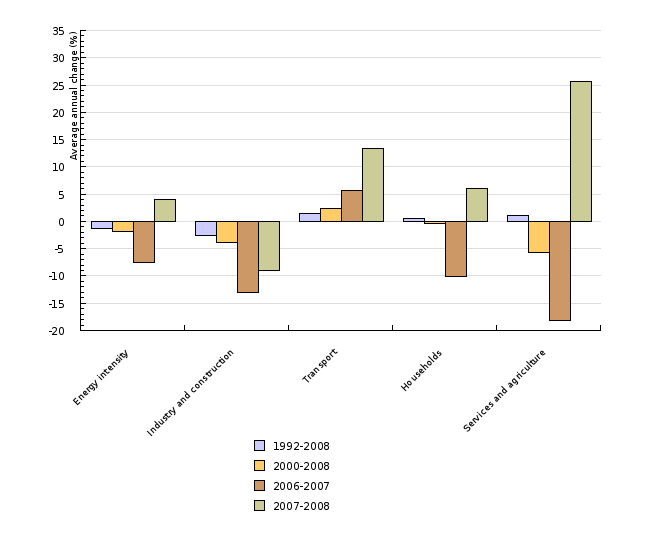
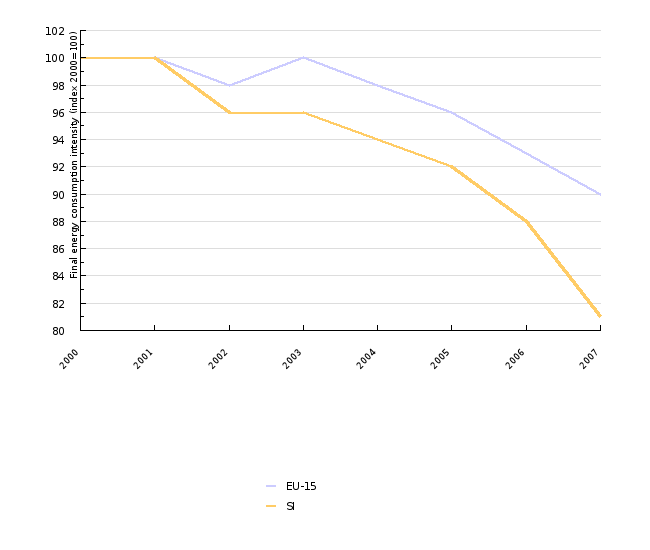
According to the indicator of the intensity of final energy consumption, Slovenia is below the EU-15 average. After a sharp decrease in 2006 and 2007, the intensity increased again in 2008. It decreased only in industry, while in other sectors it increased – the most in services, agriculture and transport.
Definition
The indicator final energy consumption is calculated as a ratio between final energy consumption and generated gross domestic product (GDP). The indicator of energy intensity shows how efficiently the Slovenian economy uses energy in creating production units. It is indicated in thousand tonnes of oil equivalent (ktoe) per million EUR (mio €), which are expressed in fixed prices of the previous year, with the reference year being 2000 and the EUR/SIT exchange rate from 2000.
Final energy consumption is defined as the sum of energy in the final consumption sector – processing activities and construction, transport and wider consumption, including households, services and agriculture.
Gross domestic product is defined as the market value of all final products and services generated by the Slovenian economy in one year.
Charts
Jozef Stefan Institute, 2009.
| 1992 | 1993 | 1994 | 1995 | 1996 | 1997 | 1998 | 1999 | 2000 | 2001 | ||
|---|---|---|---|---|---|---|---|---|---|---|---|
| Energy intensity | toe/mio € 2000 | 215 | 226 | 227 | 228 | 245 | 240 | 223 | 213 | 206 | 208 |
| Industry and construction | toe/mio € 2000 | 237 | 239 | 249 | 232 | 223 | 216 | 209 | 200 | 213 | 192 |
| Transport | toe/mio € 2000 | 57 | 67 | 71 | 76 | 82 | 82 | 70 | 63 | 59 | 61 |
| Households | toe/mio € 2000 | 514 | 562 | 557 | 597 | 528 | 542 | 526 | 558 | 572 | 570 |
| Services and agriculture | toe/mio € 2000 | 29 | 32 | 28 | 29 | 71 | 68 | 72 | 72 | 56 | 71 |
| Energy intensity | Index (1992 = 100) | 100 | 105 | 106 | 106 | 114 | 112 | 104 | 99 | 96 | 97 |
| Industry and construction | Index (1992 = 100) | 100 | 101 | 105 | 98 | 94 | 91 | 88 | 84 | 90 | 81 |
| Transport | Index (1992 = 100) | 100 | 118 | 125 | 133 | 144 | 144 | 123 | 111 | 104 | 107 |
| Households | Index (1992 = 100) | 100 | 109 | 108 | 116 | 103 | 105 | 102 | 109 | 111 | 111 |
| Services and agriculture | Index (1992 = 100) | 100 | 110 | 97 | 100 | 245 | 234 | 248 | 248 | 193 | 245 |
| 2002 | 2003 | 2004 | 2005 | 2006 | 2007 | 2008 | |||||
| Energy intensity | toe/mio € 2000 | 200 | 200 | 196 | 191 | 183 | 169 | 176 | |||
| Industry and construction | toe/mio € 2000 | 177 | 206 | 200 | 205 | 196 | 170 | 155 | |||
| Transport | toe/mio € 2000 | 60 | 59 | 59 | 60 | 59 | 63 | 71 | |||
| Households | toe/mio € 2000 | 587 | 631 | 622 | 597 | 580 | 522 | 554 | |||
| Services and agriculture | toe/mio € 2000 | 67 | 44 | 46 | 38 | 34 | 28 | 35 | |||
| Energy intensity | Index (1992 = 100) | 93 | 93 | 91 | 89 | 85 | 79 | 82 | |||
| Industry and construction | Index (1992 = 100) | 75 | 87 | 84 | 86 | 83 | 72 | 65 | |||
| Transport | Index (1992 = 100) | 105 | 104 | 104 | 105 | 104 | 111 | 125 | |||
| Households | Index (1992 = 100) | 114 | 123 | 121 | 116 | 113 | 102 | 108 | |||
| Services and agriculture | Index (1992 = 100) | 231 | 152 | 159 | 131 | 117 | 97 | 121 |
Statistical Office of the RS, 2009; Jožef Stefan Institute, 2009.
| 2000 | 2001 | 2002 | 2003 | 2004 | 2005 | 2006 | 2007 | 2008 | ||
|---|---|---|---|---|---|---|---|---|---|---|
| Households (inhabitants) | Index (2000=100) | 100 | 100 | 103 | 110 | 109 | 104 | 101 | 91 | 97 |
| Households (residental area) | Index (2000=100) | 100 | 99 | 100 | 106 | 104 | 99 | 95 | 85 | 89 |
| Households (inhabitants) (T correction) | Index (2000=100) | 100 | 92 | 98 | 96 | 95 | 88 | 94 | 87 | 88 |
| Households (residental area)(T correction) | Index (2000=100) | 100 | 91 | 96 | 92 | 91 | 83 | 88 | 81 | 81 |
Jozef Stefan Institute, 2009; Statistical Office of the RS, 2009.
| Energy intensity | Industry and construction | Transport | Households | Services and agriculture | ||
|---|---|---|---|---|---|---|
| 1992-2008 | %/year | -1.2 | -2.6 | 1.4 | 0.5 | 1.2 |
| 2000-2008 | %/year | -1.9 | -3.9 | 2.3 | -0.4 | -5.7 |
| 2006-2007 | %/year | -7.5 | -13.1 | 5.6 | -10 | -18.3 |
| 2007-2008 | %/year | 4 | -9.1 | 13.4 | 6.1 | 25.7 |
Eurostat, 2009.
| 2000 | 2001 | 2002 | 2003 | 2004 | 2005 | 2006 | 2007 | ||
|---|---|---|---|---|---|---|---|---|---|
| EU-15 | toe/mio EUR 2000 | 110 | 110 | 108 | 109 | 108 | 106 | 103 | 98 |
| SI | toe/mio EUR 2001 | 207 | 208 | 199 | 199 | 195 | 191 | 182 | 168 |
| EU-15 | Index (2000 = 100) | 100 | 100 | 98 | 100 | 98 | 96 | 93 | 90 |
| SI | Index (2000 = 100) | 100 | 100 | 96 | 96 | 94 | 92 | 88 | 81 |
Goals
Slovenian energy policy stipulates a decrease in the economy's energy intensity; however, it does not stipulate specific objectives and mechanisms for the improvement of energy intensity. Specific objectives are defined only for energy efficiency, which is an important factor for the economy's energy intensity:
- 9 % savings of final energy in 2008-2016, in the area of final energy efficiency;
- savings of up to 20 % of energy until 2020.
Comment
Economic development is conditional upon higher energy consumption; however, especially in more developed countries, a trend that the final energy consumption is staying behind the growth of the generated gross domestic product can be noticed. Efficient energy consumption represents an important challenge for Slovenia. Besides improving the economy's competitiveness, the reduction of energy intensity also represents a very efficient method of providing reliable energy supply, a reduction in greenhouse gas emissions and encouraging the development of a market with high energy efficiency technology. Energy intensity of final energy consumption measures the energy consumption in the generation of product units and indicates how efficiently an economy is using energy. The indicator is influenced by the efficiency of energy consumption as well as by the changes in the economy's structure.
In the period 1992-2008 in Slovenia, the gross domestic product (GDP) increased at a rate of 4.3 % annually, while the final energy consumption increased at a rate of 3.0 % annually. This is the reason why the energy intensity of final energy consumption in this period decreased at a rate of 1.2 % annually. Energy intensity of final energy consumption in 2008 amounted to 176 ktoe per million EUR of gross domestic product (indicated in prices of the year 2000); in 1992, it amounted to 215 toe/mioEUR2000. In the period 1992-1996 it increased, while in 1997 it again began to decrease – initially at a higher rate and at the beginning of the new millennium at a lower rate. In 2005 and 2006 it decreased again at a higher rate, while in 2008 the intensity increased. The average change of the indicator in the period 1992-2000 amounted to –0.5 % annually; in the period 2000-2007, the changes of the indicator were more intense (–2.8 % at an annual level). The increase in intensity in 2008 amounted to 4 %, which represents a deviation from the planned trends.
A review of sectoral indicators in the period 1992-2008 shows positive changes in industry, while in all other sectors the intensity of 2008 was higher than in 1992. In 2007, the intensity in services and agriculture was still lower than in 1992; however, due to a higher growth of energy consumption in 2008, the intensity increased. Significant growth of energy consumption in 2008 was recorded also in transport and households, the result of which was the fact that the energy intensity moved away from the values of 1992. Transport remains the most problematic sector, since the intensity is still increasing, which is largely a result of an increase in transit transport.
The intensity of energy consumption in industry in 2008 amounted to 155 toe/mil EUR 2000. In 2007, the intensity was 49 % higher than in the EU-15. The difference between the intensity of the Slovenian industry and the EU-15 average has decreased by 19 percentage points since 2000. The intensity of final energy consumption in industry is influenced by the efficiency of energy consumption in companies and by the structure of industry (share of energy intensive industries). Slovenia has higher energy intensity than the EU-15 due to the higher share of energy intensive industries in added value (Slovenia 31 %, EU-15 26 %) and higher intensity of individual industries. Due to the small size of Slovenia, activities in larger companies significantly influence the intensity. In 2002, the Talum company opened a new electrolysis plant for aluminium production, due to which electricity consumption in 2003 strongly increased, which led to an increase in energy intensity. A reverse effect was indicated in 2007 by the gradual shutdown of electrolysis B in the same company (the shutdown of the electrolysis was significantly recorded in consumption in 2008) or the closing of production of cellulose in the Vipap company. Furthermore, the increasing prices of energy products and electricity influenced the energy consumption in industry, while in 2008 the economic crisis was a huge factor. In the period 2000-2008, the intensity decreased at an annual rate of 3.9 %, whereby the period can be subdivided into two periods of rapid decrease (2000-2002 and 2006-2008) and a period of increase (2003-2005). In the period 1992-2000, the intensity decreased at an average annual rate of 1.3 %. In 2008, the intensity decreased by 9 %.
Transport is the only sector in which the indicator has a positive average annual growth (1.4 % and 2.3 %) in both periods, 1992-2008 and 2000-2008. Furthermore, the average annual growth of the indicator in 2008 (13.4 %) was by far the biggest after 1993. In 2008, the value of the indicator amounted to 71 toe/mil € 2000. In 2007, the intensity in Slovenia was 82 % above the EU-15 average. The reason for a negative trend in the development of transport energy intensity is a high growth of the consumption of engine fuels, which is a result of an increased sub-urbanisation and longer distances, higher number and more frequent use of cars, changes in the living habits of the population and, largely, also of the intensive growth of transit transport, especially after the entry of Slovenia into the EU (Božičnik, 2006).
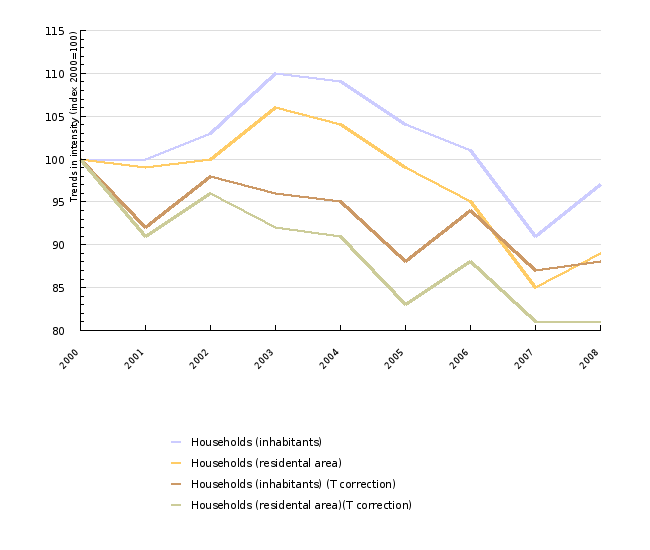
After an increasing period until 2003, the energy intensity in households decreased for four years, while in 2008 it increased again. After a significant decrease in 2007 by 10.6 %, it increased again in 2008 by 6.1 %. The increase in intensity is a result of the delay of the purchase of liquid fuels in 2007 and a colder winter in 2008. If the influence of cold winters is put aside, the intensity in 2007 decreased by 7.1 % and in 2008 it increased by 0.6 %. With regard to the EU-15 average, slightly lower energy intensity is typical for this sector, which is largely a result of the differences in living standards.
Instead of using the factor of population, the indicator can be calculated also by another influential factor – residential surface. In this case, a faster decrease of the indicator can be noticed, since the surface of housing has been increasing at a faster rate than the number of inhabitants; the intensity decreased also in 2008.
In the analysis of the trends of the indicator, attention must also be paid to a weakness of the statistical data. Namely, the data for the consumption of wood biomass in households have been the same since 2002, when the last survey on the energy consumption in households was made. Furthermore, the Statistical Office of the Republic of Slovenia does not keep a statistic on the consumption of solar or geothermal energy.
The intensity of energy consumption in the service sector and agriculture changed the most in the observed period. In 1996 it strongly increased, while in 2003 it strongly decreased. After the increasing period in 2004, it increased by 40 % in the period 2005-2007. In 2008, it increased by 26 %. The reason for such trends is that the energy consumption in this sector is calculated as residue, which is why the methodological changes in data collection in any other sector strongly influence this sector.
The reason for a high indicator of energy intensity of final energy consumption in Slovenia is largely the energy inefficiency of all sectors, which is understandable with regard to the lower development level of the Slovenian economy; however, the structure is also one of the reasons. For the Slovenian economy, it is characteristic that the share of added value generated in industry is above the EU-25 average, while the share of wider consumption (services and households) is below the EU-25 average.
An increase in energy efficiency is one of the main objectives of the European energy and environmental policy. This is clear also from the objectives set by the EU for 2020 (20 % reduction in greenhouse gas emissions, 20 % share of renewable energy sources and 20 % energy savings), since the increase in energy efficiency can strongly influence the attainment of all three objectives. The EU based its policy of reducing the energy intensity on 5 foundations:
• general strategic framework and activities within the European action plan for energy efficiency (COM(2006)545 final)
• national action plans for energy efficiency prepared in accordance with the Directive on energy efficiency and energy services (Directive 2006/32/EC)
• legislative framework for the most important energy use sector – buildings – and products using energy
• instruments, such as target financing, informing and awareness as well as different types of associations (association of mayors, Sustainable Energy Europe, etc.) and
• international cooperation in the area of energy efficiency.
An important conclusion of the report »Energy efficiency: delivering the 20 % target« is that the measures in force will not be enough for the achievement of 20 % of energy savings; therefore, the policy of reducing energy intensity will have to be strengthened. The result of this is new legislative proposals, published by the European Commission in mid-November 2008. The proposals incorporate the amendment of the directive on the energy efficiency of buildings, expansion of directives for the marking of products using energy, and additional incentives for CHP plants (EC, 2008).
As an EU member, Slovenia must follow the EU guidelines. 2008 was very important with regard to the policy in the area of reducing energy intensity. In January 2008, the National energy efficiency action plan for the period 2008-2016 was adopted, incorporating the selection of 29 instruments in order to achieve savings in the amount of 4261 GWh of final energy. Part of the instruments is already in force, while some are still new ones. The complete implementation of the plan is still not provided due to the financial non-coverage of all instruments. The new Rules on the efficient use of energy in buildings (OG RS, No. 93/08) will play an important role for the reduction in intensity, since it will introduce several novelties, such as the mandatory use of renewable energy sources that must replace at least 25 % of the necessary power of installations for the heating, cooling and powering of equipment, the prescribed maximum permitted power for lighting, the prohibition of preparation of warm water with electric heaters (except in special cases), etc. Furthermore, the rules will also reduce the permitted value of heating losses. It is estimated that buildings, constructed according to the new rules, will use up to 60 % less energy than under the old rules. An important measure that will be introduced next year is also an energy performance certificate for all buildings which are placed on the real estate market. However, it is alarming that the implementation of the rules was moved to 2010, while the energy performance certificates system still did not come to life due to a setback in adopting the legislation. Furthermore, the funds for subsidies, awarded by the Eco fund, were used in October 2009, while their further fate is not known, since funds for this purpose are not reserved in the budgets for 2010 and 2011.
Methodology
Data for Slovenia and other countries
Objectives summarised by: Resolucija o Nacionalnem energetskem programu (ReNEP) (Resolution on the National Energy Programme, ReNEP, OG RS, No. 57/04) and proposal of the climate-energy package.
Source database:
The data on final energy consumption are published on the SI-STAT Data Portal – Environment and natural resources – Energy – Energy balance and energy indicators.
The data on the gross domestic product (GDP) and added value in fixed prices of the previous year are published in the SI-STAT web application – Economy – National accounts – Gross domestic product.
The data for the EU were obtained from the Eurostat web pages.
Data administrator: Statistical Office of the Republic of Slovenia and Eurostat.
Data acquisition date for the indicator: 5 December 2009
Methodology and frequency of data collection for the indicator: The data on final energy consumption, number of population and GDP are collected on an annual basis. The indicator is calculated on the basis of two sets of data. The data on final energy consumption are published by SORS on the SI-STAT Data Portal and were published on 29 September. The data on final energy consumption before 2000 were calculated from different sources (for a detailed description of the obtainment of data before 2000 see EN16 – Total energy consumption by fuel, chapter Methodology, Data for Slovenia, Qualitative information). The data on gross domestic product (GDP) and added value in fixed prices of the previous year, with the reference year being 2000 and the exchange rate being EUR/SIT2000 are published by SORS in their web pages since 1995. These are updated data (FISIM revision was implemented). The data on the GDP before 1995 are not published on the web pages of SORS, but can be obtained from SORS on the request of users. The data on population were obtained on the SI-STAT Data Portal and the data on the temperature deficit from the Environmental Agency of the Republic of Slovenia.
Sectoral intensities were defined in accordance with EEA definitions:
- The intensity of final energy consumption in industry is defined as a quotient of energy consumption in branches C, D, E and F of the NACE 2002 classification, in thousand tonnes of oil equivalent, and the sum of added values of the same branches in million EUR, in fixed prices of the previous year, with the reference year being 2000 and the exchange rate being EUR/SIT2000.
- The intensity of final energy consumption in transport is defined as a quotient of energy consumption in transport, in thousand tonnes of oil equivalent, and gross domestic product in million EUR, in fixed prices of the previous year, with the reference year being 2000 and the exchange rate being EUR/SIT 2000. The intensity of final energy in households is defined as a quotient of energy consumption in households, in thousand tonnes of oil equivalent and the number of population on 31 December.
- The intensity of final energy consumption in other sectors (services and agriculture) is defined as a quotient of the remaining energy consumption, in thousand tonnes of oil equivalent, and the sum of added values of the branches A, B and G-O of the NACE 2002 classification in million EUR, in fixed prices of the previous year, with the reference year being 2000 and the exchange rate being EUR/SIT 2000. The indicator provides a review of the situation and changes in energy intensity for Slovenia since 1992; namely, before that year the data on final energy consumption are not available.
Data processing methodology: The methodology of indicators of the intensity of final energy consumption in the data sheet is the same as the one used by the EEA.
The average annual changes are calculated as:
[(last year/last base year)(1/number of years)–1]*100.
The calculation of the share of an individual sector in the total indicator of energy intensity:
(final energy consumption in the sector/GDP).
The annual growth for the indicator is sometimes shown in percentage points. A percentage point is a unit used for the comparison of different rates of growth. A percentage point includes an absolute comparison calculated by the formula (nthis year)-(nlast year)=16 %–15 %=1 pp (for instance: if last year the growth was 15 % and this year 16 %, then this year the growth was higher by 1 percentage point). The difference in growth can also be expressed in a relative comparison using the formula [(nthis year/nlast year)*100]–100=[(16 %/15 %)*100]–100=6.7 %, where the growth is indicated in percentages.
Geographical coverage: The EU-15 is composed of older EU Member States: Austria, Belgium, Denmark, Finland, France, Germany, Greece, Ireland, Italy, Luxembourg, the Netherlands, Portugal, Spain, Sweden, the United Kingdom.
Information concerning data quality:
- Advantages and disadvantages of the indicator: The source of basic data is SORS for the entire time series, which provides a more efficient and consistent analysis of an individual sector.
- Relevance, accuracy, robustness, uncertainty:
Reliability of the indicator (archive data): See the data sheet EN16 – Total energy consumption by fuel.
Uncertainty of the indicator (scenarios/projections): Scenarios and projections are not available.
- Overall assessment (1 = no major comments, 3 = data to be considered with reservation):
Relevance: 2
Accuracy: 2
Completeness over time: 2
Completeness over space: 1
Other sources and literature:
- Action Plan for Energy Efficiency: Realising the Potential; COM(2006)545 final; Brussels; 19 October 2006.
- Božičnik S., Letnik T., Cvahte J. Analysis of transit transport through the Republic of Slovenia and assessment of possible transport-political measures for its reduction, University of Maribor – Faculty of Civil Engineering, Maribor, 2006.
- COMMUNICATION FROM THE COMMISSION TO THE EUROPEAN PARLIAMENT, THE COUNCIL, THE ECONOMIC AND SOCIAL COMMITTEE AND THE COMMITTEE OF THE REGIONS: Energy efficiency: delivering the 20 % target, European Commission, 2008.
- Resolucija o Nacionalnem energetskem programu (ReNEP) (Resolution on the National Energy Programme, Official Gazette of the RS, No. 57/04).
- Nacionalni akcijski načrt za energetsko učinkovitost (National efficiency energy action plan), MESP, 2008.


