[VD08] Drinking water quality 

Key message

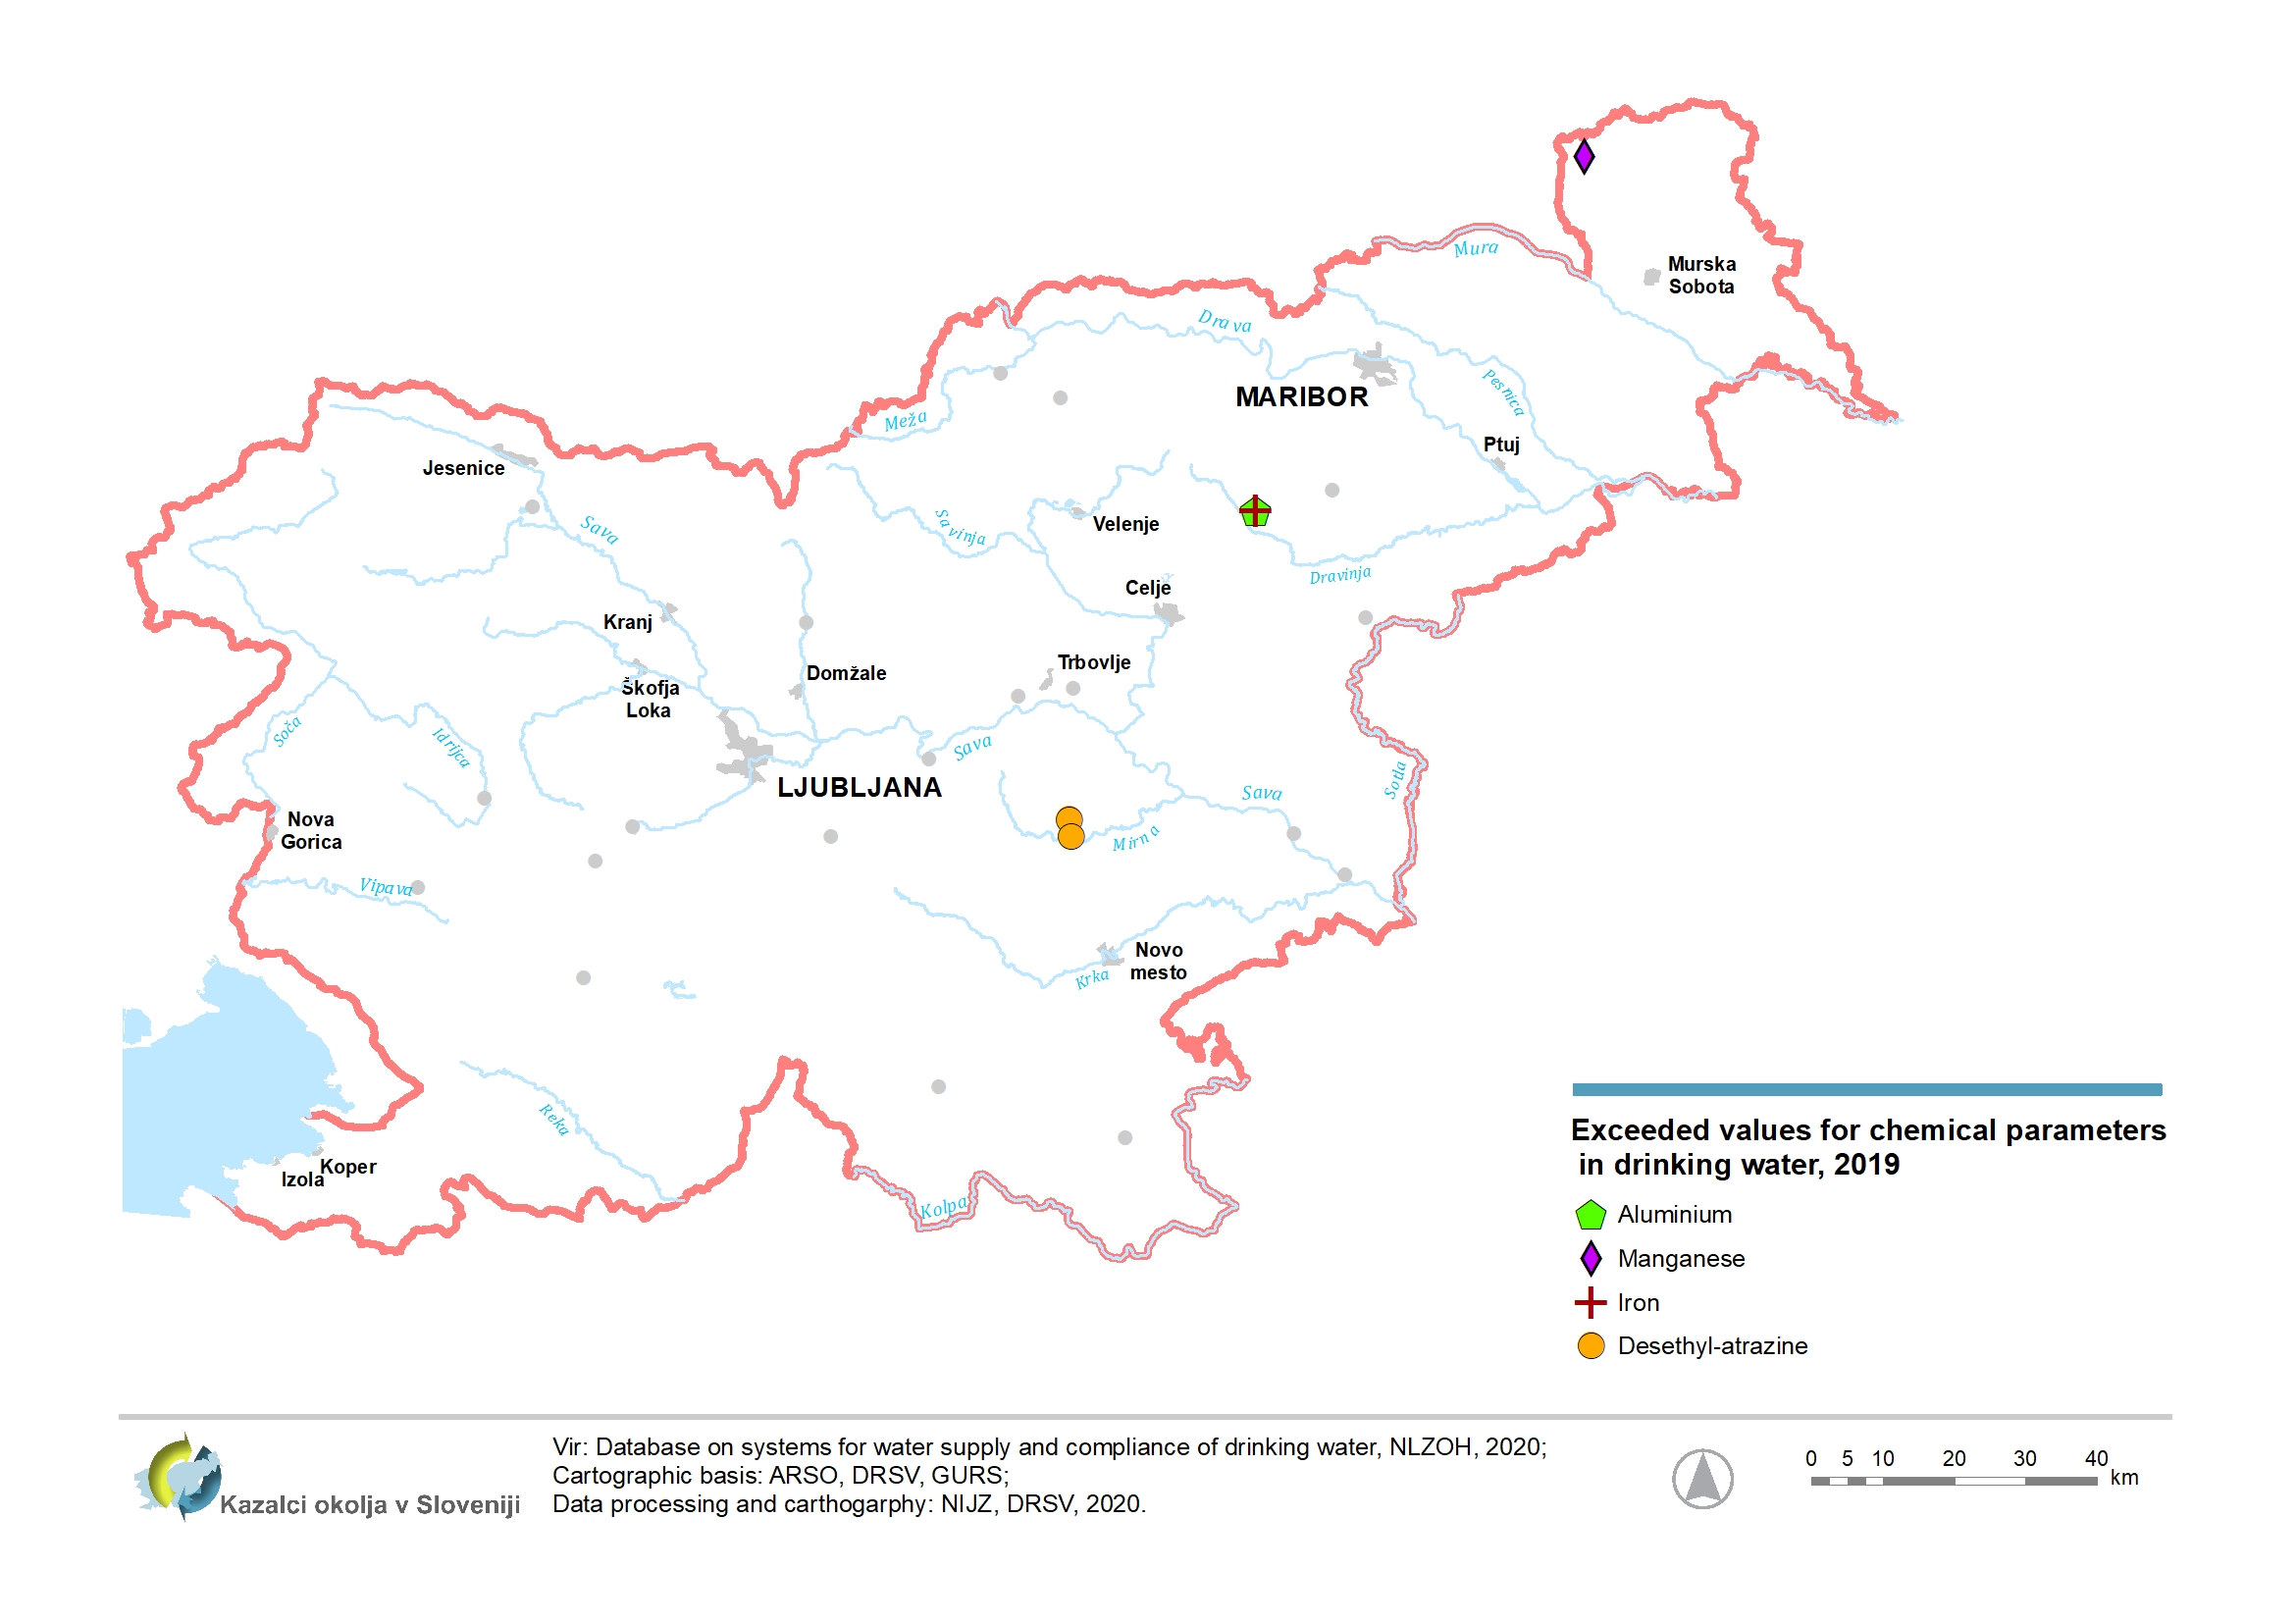
In 2019, drinking water monitoring was carried out in supply zones (water supply systems) that supply 50 or more persons (93% of the population). Large and medium supply zones that supply more than 1,000 (85%) of the population, generally have adequate drinking water quality. The smallest supply zones that supply 50-500 people are the least regulated, in comparison to larger due to the fecal contamination, as some with surface and karst water resources. The results of chemical analysis exceeded limit value of the pesticide desethyl-atrazine (1,130 people exposed), and indicator parameters: aluminium, manganese and iron. In addition, audit monitoring for chemical parameters were not carried out for 96,518 residents on supply zones with 50-500 residents. In the period 2004-2019, the quality of drinking water has improved, mainly due to the nitrates and pesticides.
Charts
Insitute of Public health, 2005-2008; The Health Insurance Institute Maribor, 2009-2013; National Laboratory of Health, Environment and Food, 2014-2020 (21. 10. 2020)
1-Due to changes in sampling methodology - a different number of samples in each of the years in the size range of 50-500 inhabitants is not possible to estimate the trend for small supply zone, 2004-2019.
2 For smaller supply zone (50-500 residents) were large differences in the number of samples taken for check monitoring, in individual years: in 2004-2005 were 4-5 samples, in 2006-2009 one sample, in 2010 2 samples; smaller supply zone with 50-500 residents contribute the majority of non-compliant samples for E. coli.
| small (50-1000)[%] | medium (1001-10.000)[%] | large (>10.000)[%] | total[%] | |
|---|---|---|---|---|
| 2004 | 29 | 6.70 | 2.60 | 19 |
| 2005 | 28 | 5.80 | 1.70 | 18.40 |
| 2006 | 24.10 | 4.60 | 0.40 | 10.30 |
| 2007 | 24.50 | 5.30 | 2.10 | 10.90 |
| 2008 | 24.61 | 4.45 | 0.71 | 10.30 |
| 2009 | 19.34 | 4.27 | 1.19 | 8.45 |
| 2010 | 18.89 | 3.68 | 0.51 | 9.05 |
| 2011 | 16 | 1 | 0.80 | 7.60 |
| 2012 | 12.30 | 1.80 | 0.40 | 6.70 |
| 2013 | 8.60 | 1.33 | 0.44 | 4.34 |
| 2014 | 7.87 | 1.11 | 0.17 | 3.67 |
| 2015 | 5.80 | 1.10 | 0.20 | 3 |
| 2016 | 5.70 | 1.70 | 0.10 | 3.10 |
| 2017 | 5.39 | 0.61 | 0.10 | 2.77 |
| 2018 | 4.10 | 0.80 | 0 | 2.10 |
| 2019 | 3.40 | 0.47 | 0.10 | 1.70 |
National laboratory of Health, Environment and Food, 2020 (21. 10. 2020)
| small (50-1000)[%] | medium (1001-10.000)[%] | big (>10.000)[%] | |
|---|---|---|---|
| Gorenjska | 1.06 | 0 | 0 |
| Goriška | 4.05 | 0 | 0 |
| JV Slovenija | 2.63 | 0 | 0 |
| Koroška | 2.73 | 0 | 0 |
| Obalno-kraška | 15 | 0 | 0 |
| Osrednjeslovenska | 2.05 | 0 | 0.31 |
| Podravska | 5.10 | 2.56 | 0 |
| Pomurska | 0 | 0 | 0 |
| Posavska | 0.78 | 0 | 0 |
| Primorsko-notranjska | 7.50 | 0 | 0 |
| Savinjska | 3.45 | 0 | 0 |
| Zasavska | 2.42 | 2.44 | 0 |
| Slovenija | 3.40 | 0.47 | 0.10 |
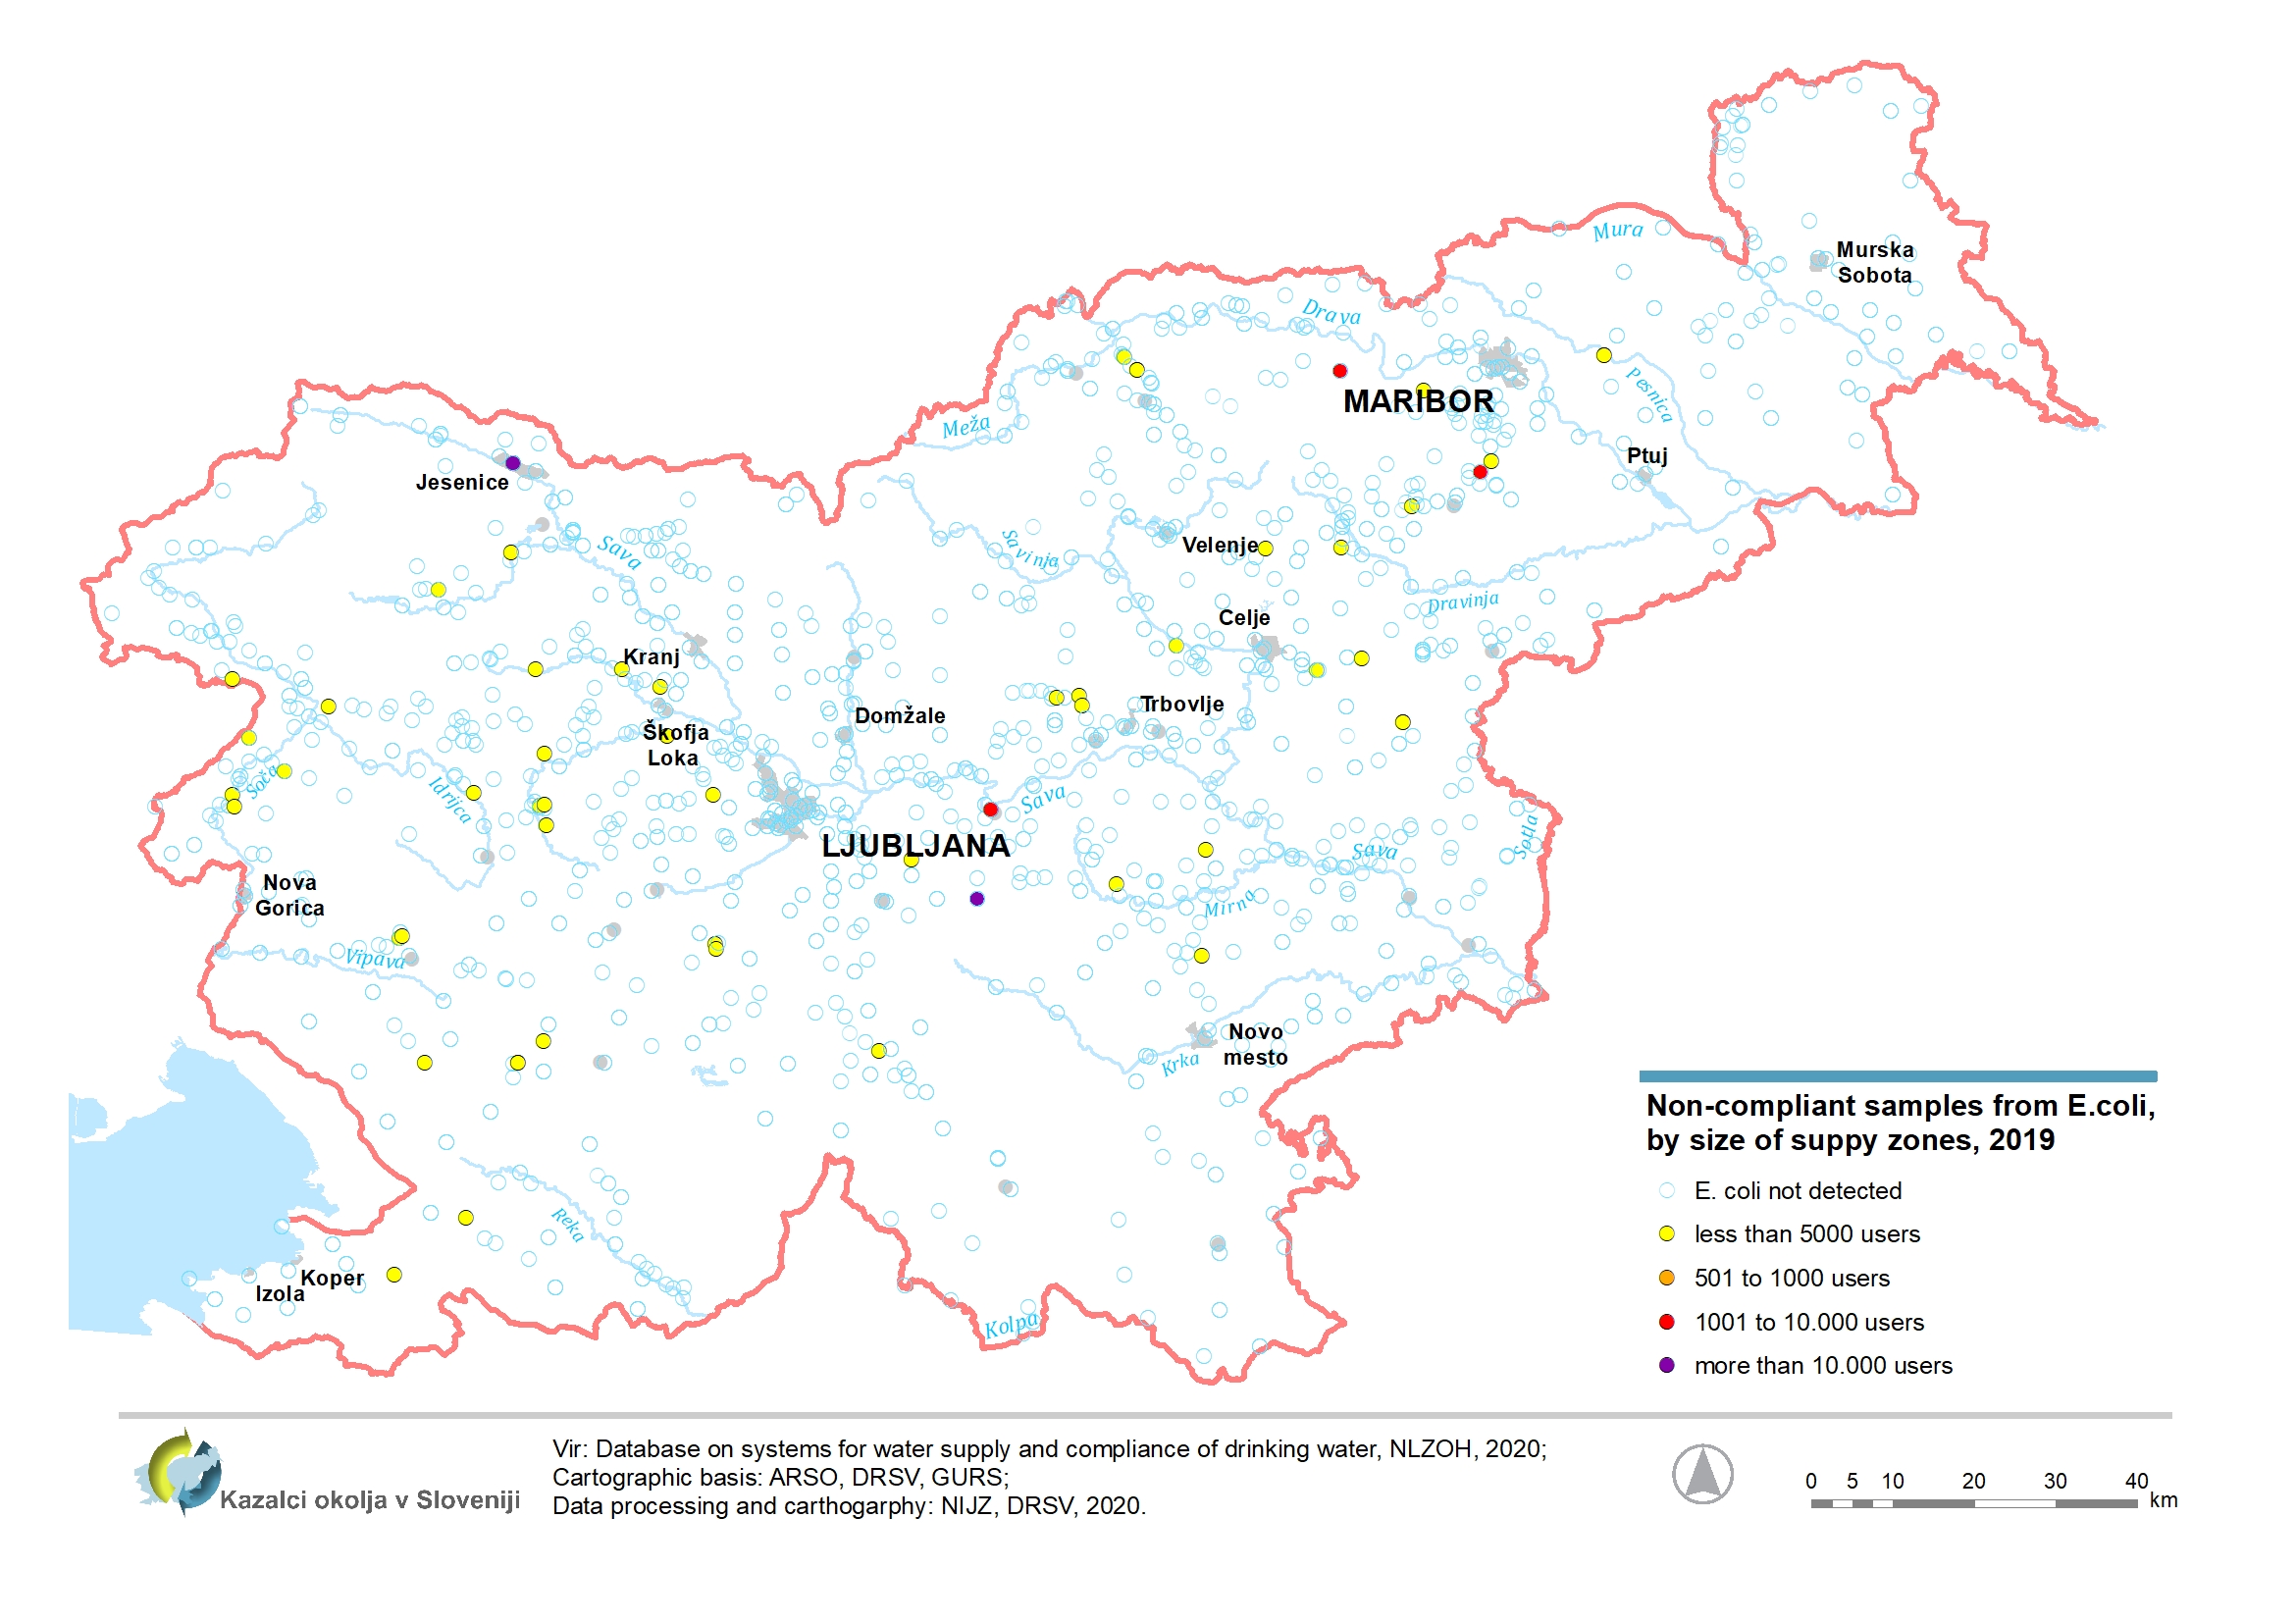
Database on systems for water supply and compliance of drinking water 2019, National Laboratory of Health, Environment and Food 2020; cartographic basis: Slovenian environment agency, The surveying and mapping authority of the RS; Data processing and cartography: National Institute for public health, 2019. (21. 10. 2020)
One non-compliant sample due to the presence of Escherichia coli was also in the framework of periodic trials in large supply areas (Large (> 10,000);
- Total regular and periodic tests: 2 non-compliant samples in a large class of 10,000 - 20,000 inhabitants.
Institute of Public health, 2005-2008; The Health Insurance Institute Maribor, 2009-2013; National Laboratory of Health, Environment and Food, 2014-2020 (21. 10. 2020)
In 2019, on the small supply zone audit monitoring are carried out in the supply areas with 501 - 1000 residents. On supply areas with 50-500 inhabitants audit monitoring carried out only in 5-10% of supply areas in the 2006-2010 period - each year on the other, and at 10 % in 2014-2016.
In the years 2004-2005 and 2011-2013 and 2017-2019 audit monitoring in supply zones with 50-500 residents are not carried out.
| small (50-1000)[%] | medium (1001-10.000)[%] | big (>10.000)[%] | |
|---|---|---|---|
| 2004 | 10.60 | 2.40 | 7.10 |
| 2005 | 6.70 | 2.90 | 7.60 |
| 2006 | 6.50 | 1.70 | 2.50 |
| 2007 | 7.10 | 2.30 | 1.90 |
| 2008 | 0.61 | 1.14 | 6.83 |
| 2009 | 5.80 | 1.81 | 3 |
| 2010 | 9.20 | 0.43 | 6.95 |
| 2011 | 7.75 | 2.02 | 2.12 |
| 2012 | 4.80 | 3.40 | 2.80 |
| 2013 | 2.80 | 1.33 | 1.83 |
| 2014 | 6.96 | 2.68 | 0.89 |
| 2015 | 5.10 | 1.90 | 1.60 |
| 2016 | 3.90 | 1.20 | 3.60 |
| 2017 | 1.06 | 0.61 | 1.46 |
| 2018 | 0 | 1.80 | 1.40 |
| 2019 | 2.20 | 0 | 0 |
Insitute of Public health, 2005-2008; The Health Insurance Institute Maribor, 2009-2013; National Laboratory of Health, Environment and Food, 2014-2020 (21. 10. 2020)
Number of inhabitants refers to the supply areas in which a certain pesticide or more pesticides has been exceeded in drinking water.
| [µg/L] | [µg/L] | [µg/L] | [µg/L] | [µg/L] | [µg/L] | [µg/L] | [µg/L] | [µg/L] | [µg/L] | [µg/L] | [µg/L] | [µg/L] | [µg/L] | [µg/L] | ||
|---|---|---|---|---|---|---|---|---|---|---|---|---|---|---|---|---|
| 2004 | 0.21 | 0 | 0 | 0.29 | 0 | 0.26 | 0 | 0 | 0 | 0 | 0 | 0 | 0 | 0 | 0 | 183881 |
| 2005 | 0.16 | 0.98 | 0 | 0.32 | 0 | 0 | 0 | 0.21 | 0.57 | 0 | 0 | 0.49 | 0 | 0 | 0.93 | 151297 |
| 2006 | 0.18 | 1.40 | 0 | 0.42 | 0 | 0 | 0 | 0 | 0 | 0 | 0 | 0 | 0 | 0 | 1.40 | 36999 |
| 2007 | 0.30 | 0.48 | 0 | 0.30 | 0 | 0 | 0 | 0 | 0 | 0 | 0.21 | 0 | 0 | 0 | 0.55 | 53544 |
| 2008 | 0.20 | 0.40 | 0 | 0.30 | 0 | 0 | 0 | 0 | 0.14 | 0.12 | 0 | 0 | 0 | 0 | 0.66 | 100689 |
| 2009 | 0.15 | 0.37 | 0 | 0.26 | 0.23 | 0 | 0 | 0 | 0.65 | 0 | 0 | 0 | 0 | 0 | 0.65 | 98611 |
| 2010 | 0.19 | 0.14 | 0.16 | 0.41 | 0 | 0 | 0.11 | 0 | 0 | 0 | 0 | 0 | 0 | 0 | 0.56 | 183690 |
| 2011 | 0.21 | 0.12 | 0 | 0.42 | 0 | 0 | 0 | 0 | 0.13 | 0 | 0 | 0 | 0.12 | 0 | 0 | 83996 |
| 2012 | 0.19 | 0 | 0 | 0.25 | 0 | 0 | 0 | 0 | 0.21 | 0 | 0 | 0.16 | 0 | 0 | 0 | 105443 |
| 2013 | 0.21 | 0 | 0 | 0.58 | 0 | 0 | 0 | 0 | 0 | 0 | 0 | 0 | 0 | 0 | 0.64 | 21686 |
| 2014 | 0.21 | 0 | 0 | 0.29 | 0 | 0 | 0 | 0 | 0 | 0 | 0 | 0 | 0.27 | 0 | 0.51 | 6512 |
| 2015 | 0.22 | 0.36 | 0 | 0.27 | 0 | 0 | 0 | 0 | 0 | 0 | 0 | 0 | 0 | 0 | 0.52 | 33975 |
| 2016 | 0.10 | 0 | 0 | 0.14 | 0 | 0 | 0 | 0 | 0 | 0 | 0 | 0 | 0 | 0 | 0 | 29400 |
| 2017 | 0.14 | 0.65 | 0 | 0.13 | 0 | 0 | 0 | 0 | 0 | 0 | 0 | 0 | 0 | 0 | 0 | 28869 |
| 2018 | 0 | 0.37 | 0 | 0.12 | 0 | 0 | 0 | 0 | 0 | 0 | 0 | 0 | 0 | 0 | 0 | 1533 |
| 2019 | 0 | 0 | 0 | 0.15 | 0 | 0 | 0 | 0 | 0 | 0 | 0 | 0 | 0 | 0 | 1130 |
Insitute of Public health, 2005-2008; The Health Insurance Institute Maribor, 2009-2013; National Laboratory of Health, Environment and Food, 2014-2020 (21. 10. 2020)
Number of inhabitants refers to the supply zone in which nitrates have been exceeded in drinking water.
| Number of inhabitants[no.] | |
|---|---|
| 1995 | 112498 |
| 1996 | 89928 |
| 1997 | 22969 |
| 1998 | 1813 |
| 1999 | 2390 |
| 2000 | 1835 |
| 2001 | 3530 |
| 2002 | 3716 |
| 2003 | 15518 |
| 2004 | 12243 |
| 2005 | 4046 |
| 2006 | 34321 |
| 2007 | 3555 |
| 2008 | 4022 |
| 2009 | 4898 |
| 2010 | 3327 |
| 2011 | 3404 |
| 2012 | 2862 |
| 2013 | 2862 |
| 2014 | 3047 |
| 2015 | 2862 |
| 2016 | 0 |
| 2017 | 0 |
| 2018 | 17000 |
| 2019 | 0 |
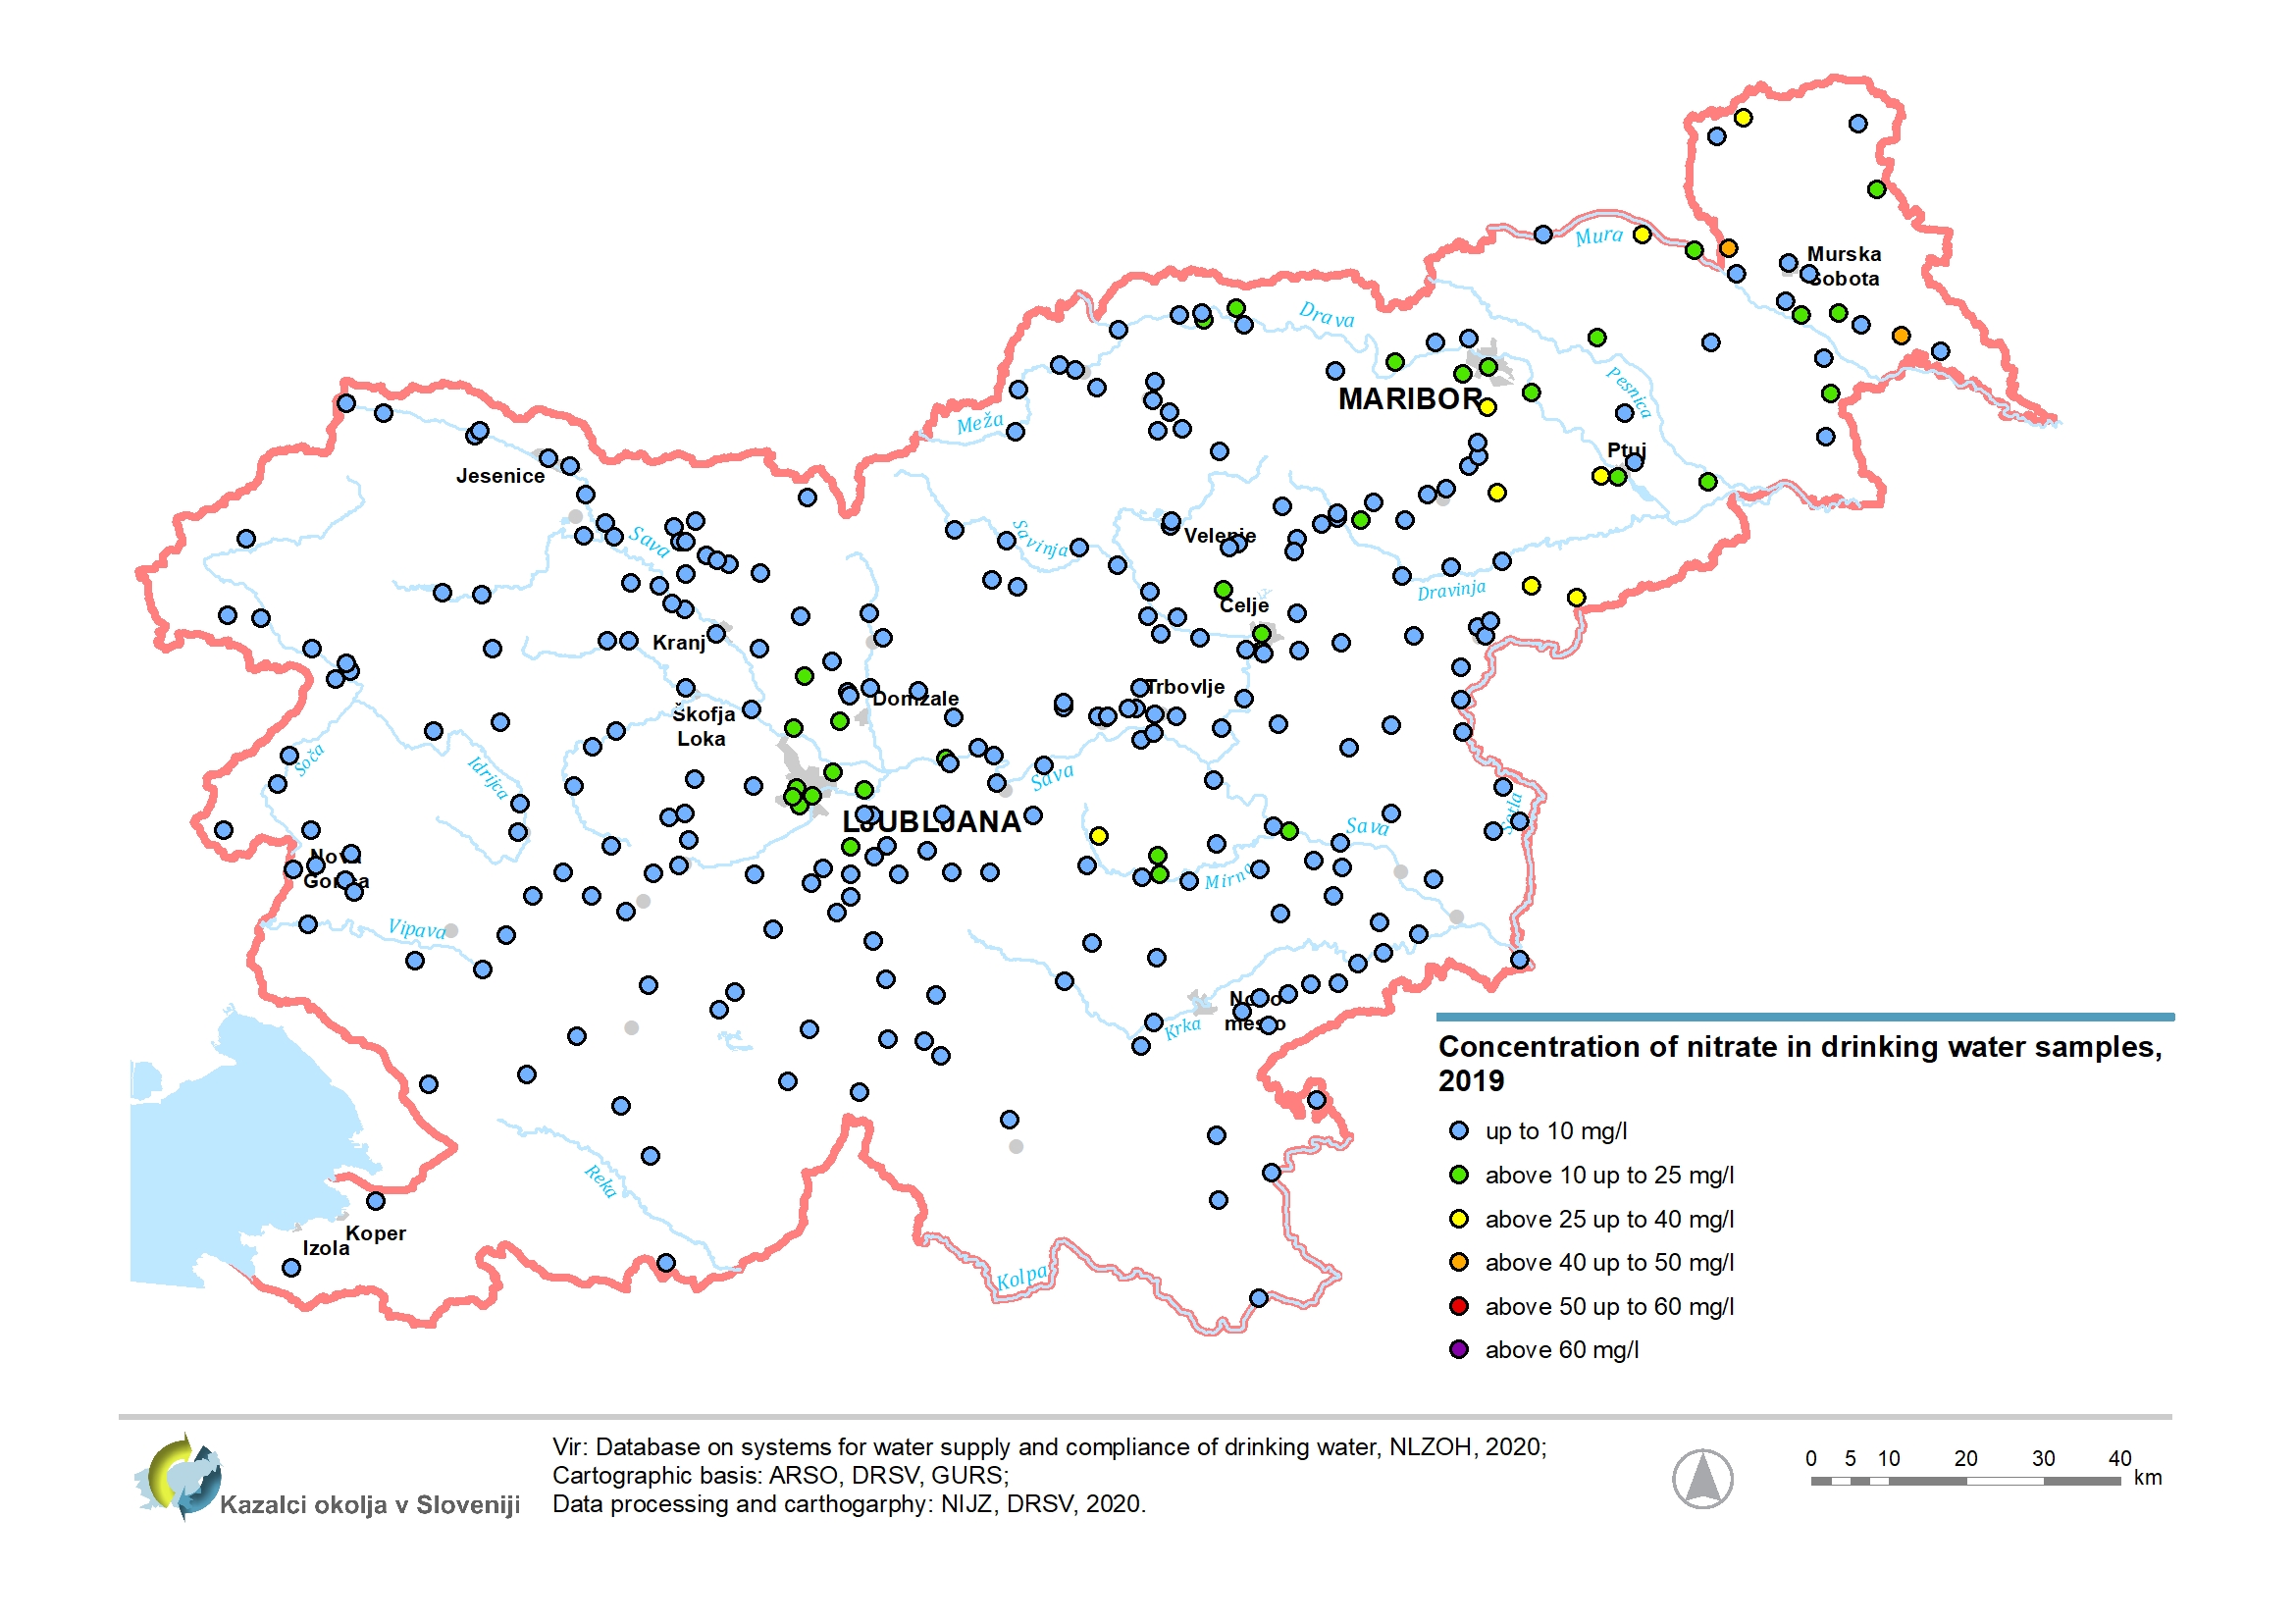
Database on systems for water supply and compliance of drinking water 2019, National Laboratory of Health, Environment and Food 2020; cartographic basis: Slovenian environment agency, The surveying and mapping authority of the RS; Data processing and cartography: National Institute for public health, 2019 (21. 10. 2020)
Database on systems for water supply and compliance of drinking water 2019, National Laboratory of Health, Environment and Food 2020; cartographic basis: Slovenian environment agency, The surveying and mapping authority of the RS; Data processing and cartography: National Institute for public health, 2019 (21. 10. 2020)


