-
-
-
-
-
-
-
-
Tools and collections
- Environmental atlas
- EIONET in Slovenia
- Environmental indicators
- IED devices
- Endangered species
- IS-waste

-
-
Tools and collections
- Environmental atlas
- EIONET in Slovenia
- Environmental indicators
- IED devices
- Endangered species
- IS-waste

[VD08] Drinking water quality 

Key message

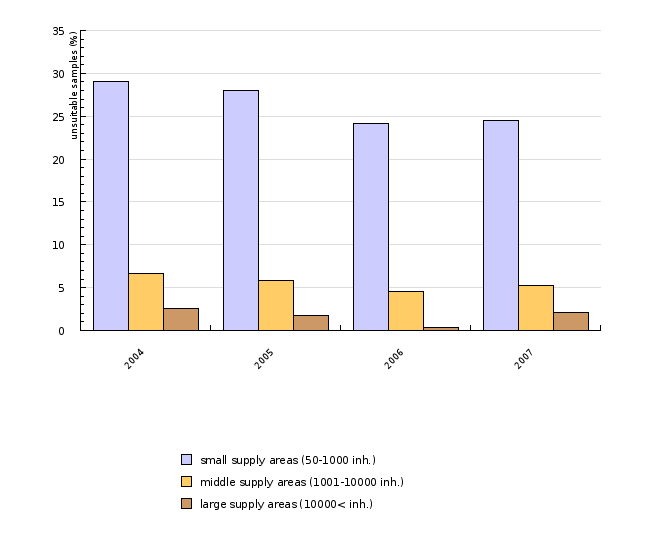
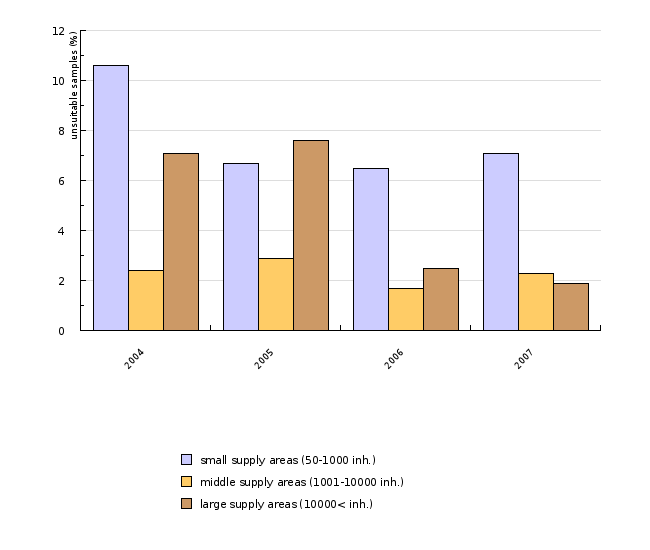
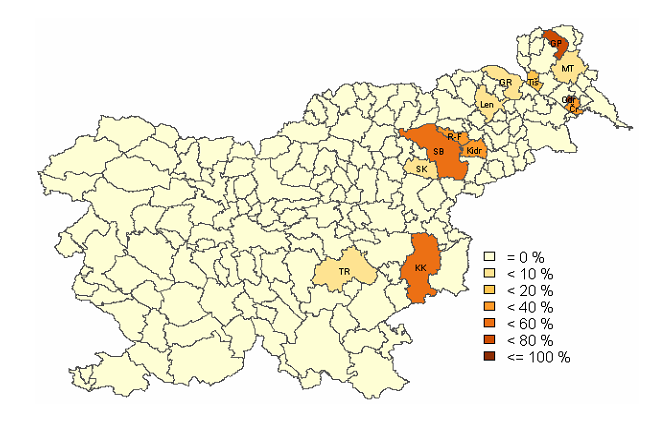
Drinking water quality in Slovenia in the period 2004-2007 has not significantly improved in terms of both microbial and chemical contamination. The trend is positive only for medium and large supply areas for reducing faecal contamination. The proportion of chemical non-compliant samples has slightly reduced mainly in large supply areas. Due to microbial, especially faecal contamination, a problem still remains for small supply areas, particularly the smallest, serving 50-500 people.
Charts
Drinking Water Supply Systems Database, Institute of Public Health of the Republic of Slovenia
| 2004 | 2005 | 2006 | 2007 | ||
|---|---|---|---|---|---|
| small supply areas (50-1000 inh.) | % | 29 | 28 | 24.1 | 24.5 |
| middle supply areas (1001-10000 inh.) | % | 6.7 | 5.8 | 4.6 | 5.3 |
| large supply areas (10000 | % | 2.6 | 1.7 | 0.4 | 2.1 |
Drinking Water Supply Systems Database, Institute of Public Health of the Republic of Slovenia
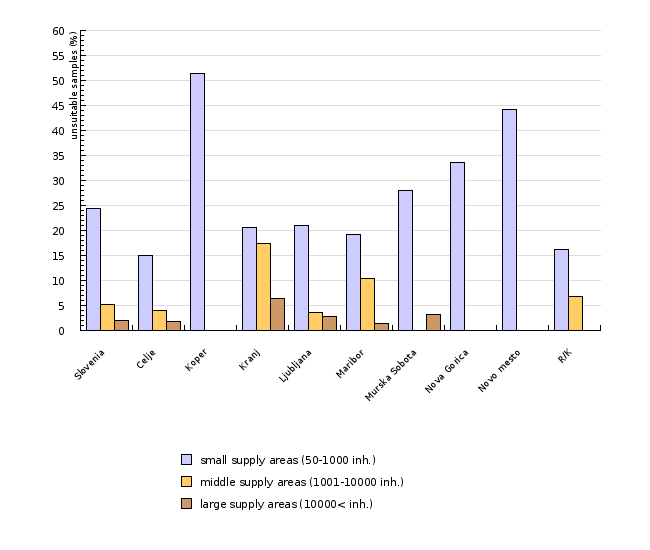
| Slovenia | Celje | Koper | Kranj | Ljubljana | Maribor | Murska Sobota | Nova Gorica | Novo mesto | R/K | ||
|---|---|---|---|---|---|---|---|---|---|---|---|
| small supply areas (50-1000 inh.) | % | 24.5 | 15.1 | 51.5 | 20.7 | 21 | 19.2 | 28.1 | 33.7 | 44.3 | 16.2 |
| middle supply areas (1001-10000 inh.) | % | 5.3 | 4 | - | 17.4 | 3.7 | 10.5 | - | - | - | 6.9 |
| large supply areas (10000 | % | 2.1 | 1.8 | - | 6.4 | 2.8 | 1.4 | 3.2 | - | - | - |
| total | % | 10.9 | 8.8 | 11.4 | 15.2 | 7.7 | 6.9 | 15 | 15.9 | 16.9 | 11.6 |
Institute of Public Health of the Republic of Slovenia, 2009
| 2004 | 2005 | 2006 | 2007 | ||
|---|---|---|---|---|---|
| small supply areas (50-1000 inh.) | % | 10.6 | 6.7 | 6.5 | 7.1 |
| middle supply areas (1001-10000 inh.) | % | 2.4 | 2.9 | 1.7 | 2.3 |
| large supply areas (10000 | % | 7.1 | 7.6 | 2.5 | 1.9 |
Drinking Water Supply Systems and Drinking water accordance Database, Institute of Public Health, 2008
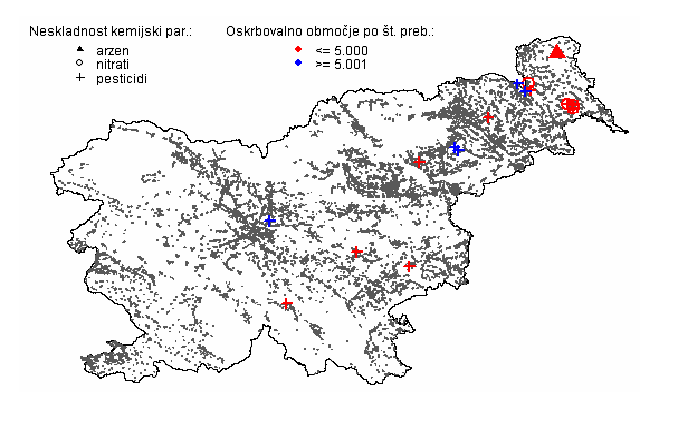
Drinking Water Supply Systems and Drinking water accordance Database, Institute of Public Health of the Republic of Slovenia, 2008; Statistical Office of the Republic of Slovenia, 2006
Methodology
Ivanka Gale, dr.med., Aleš Petrovič, dr.med. (medical specialists in hygiene), National Institute of Public Health, Center for Environmental Health


