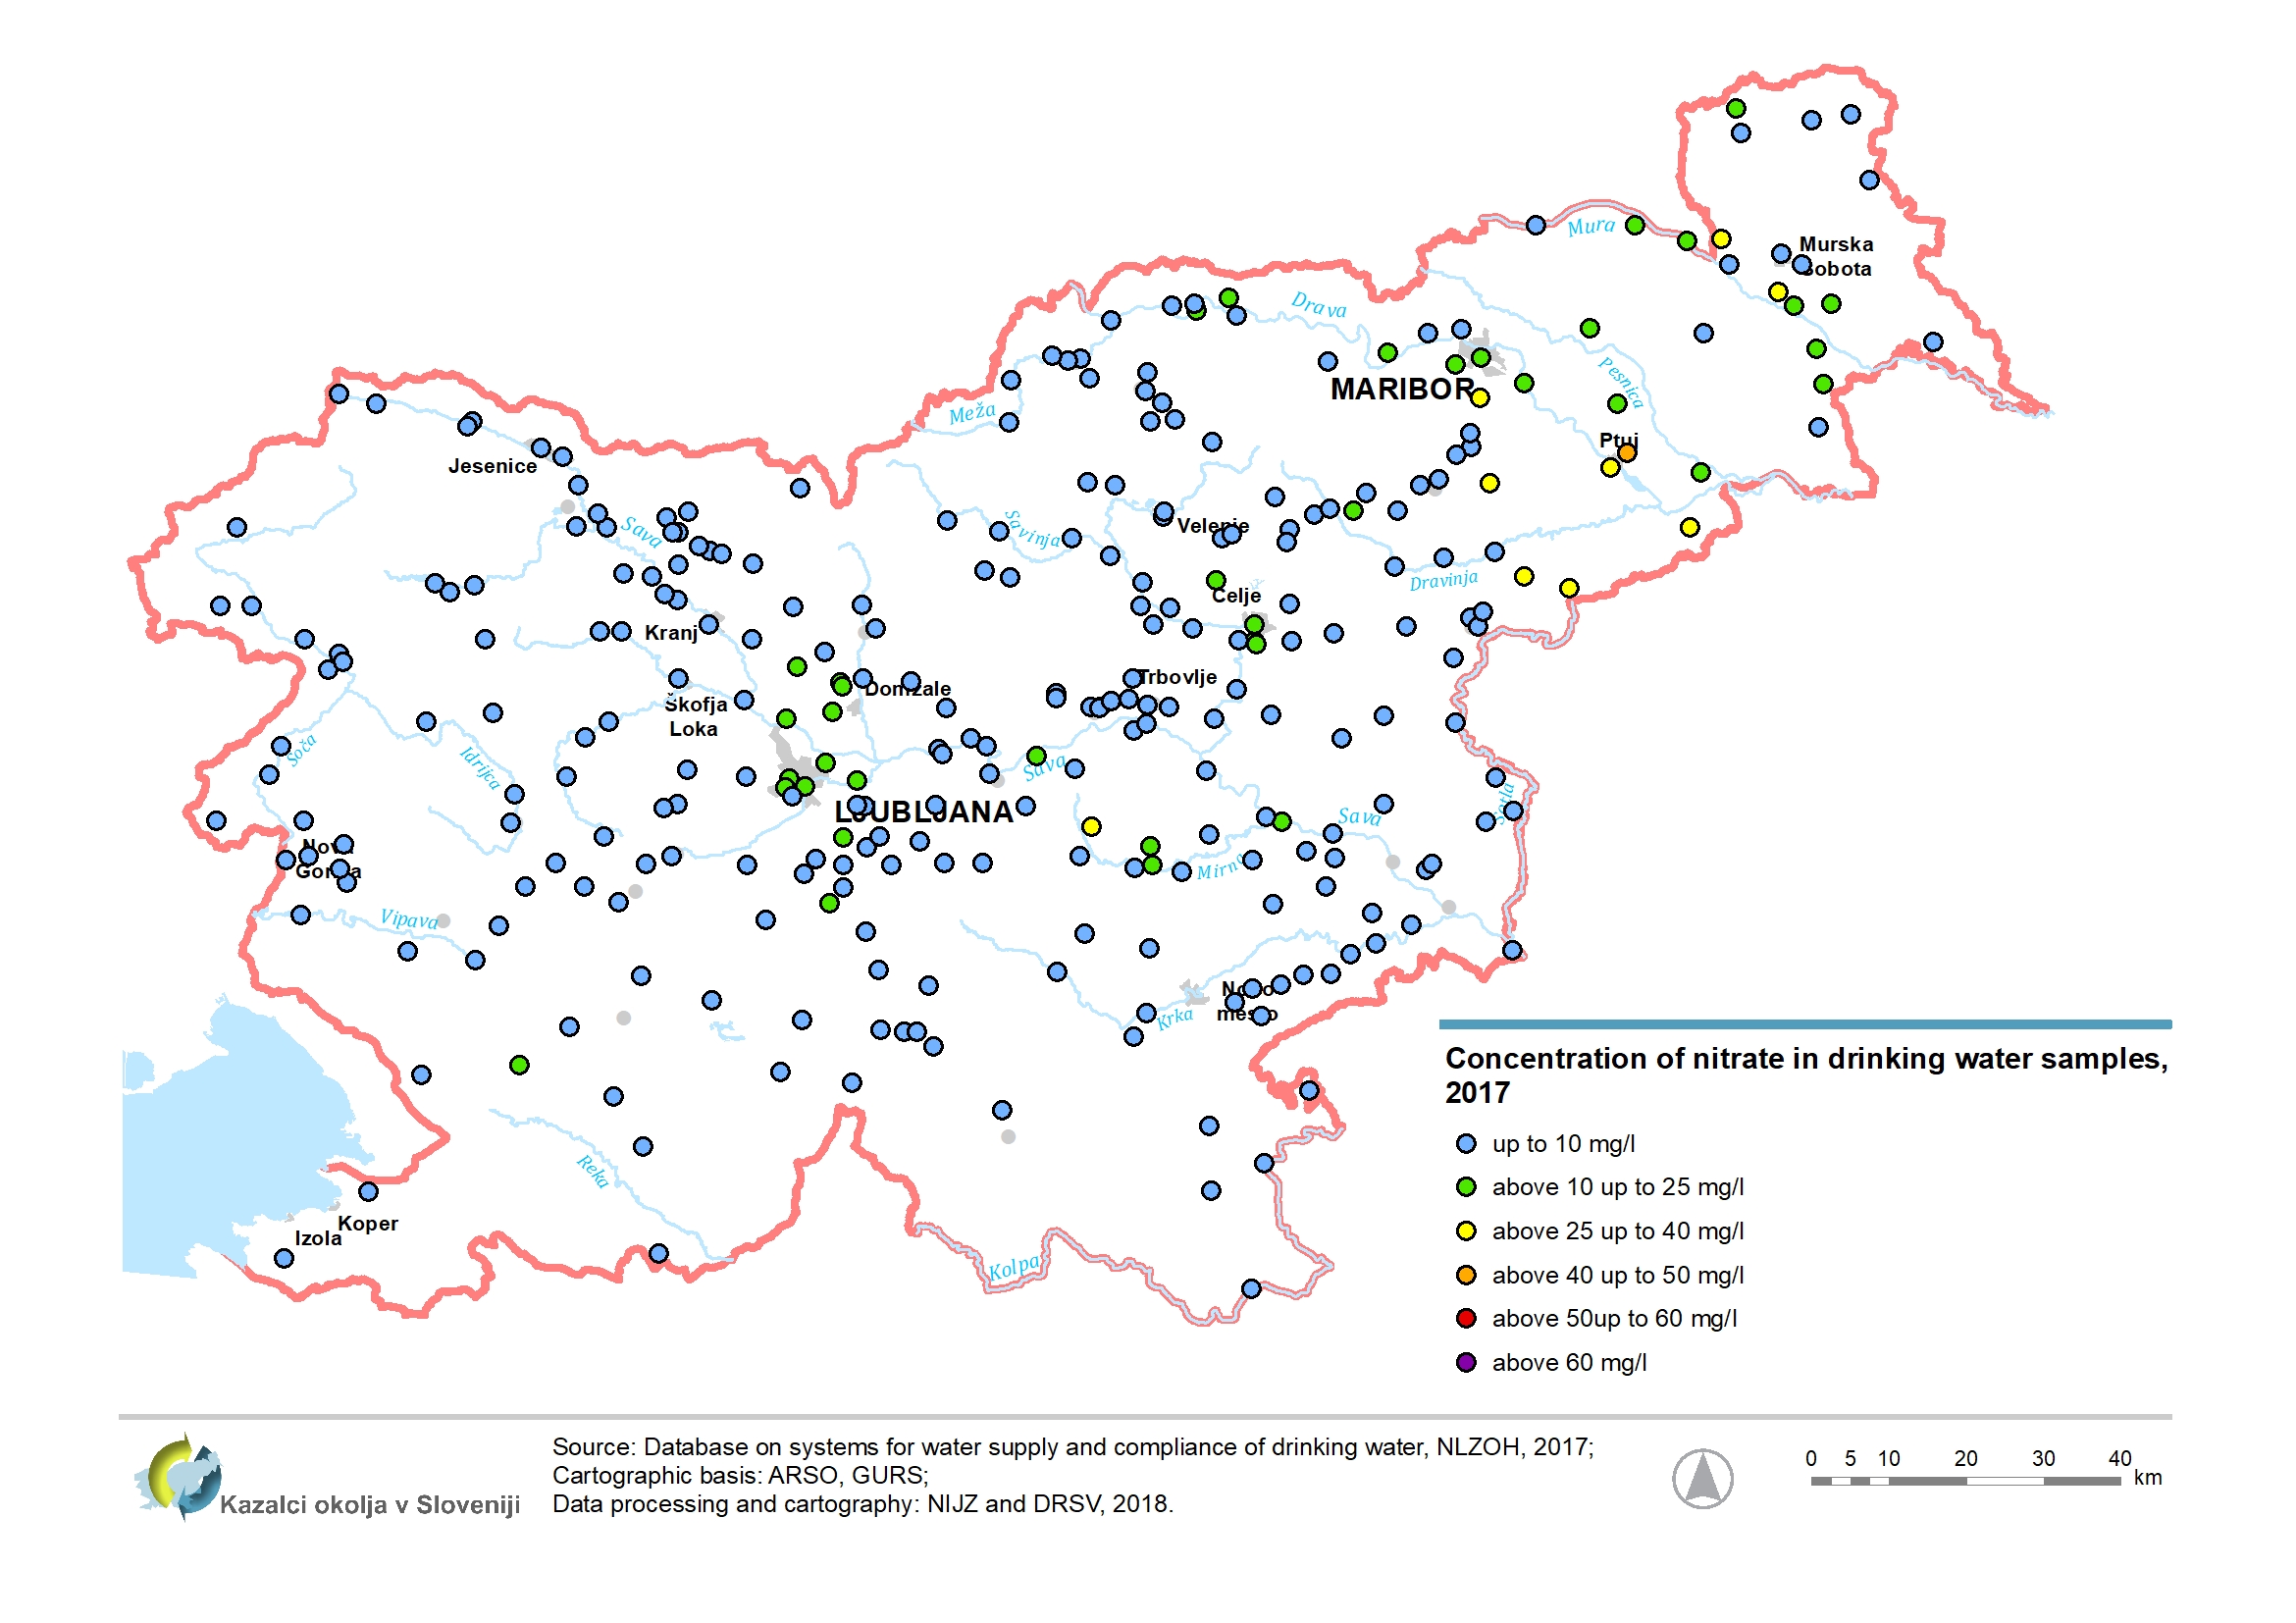
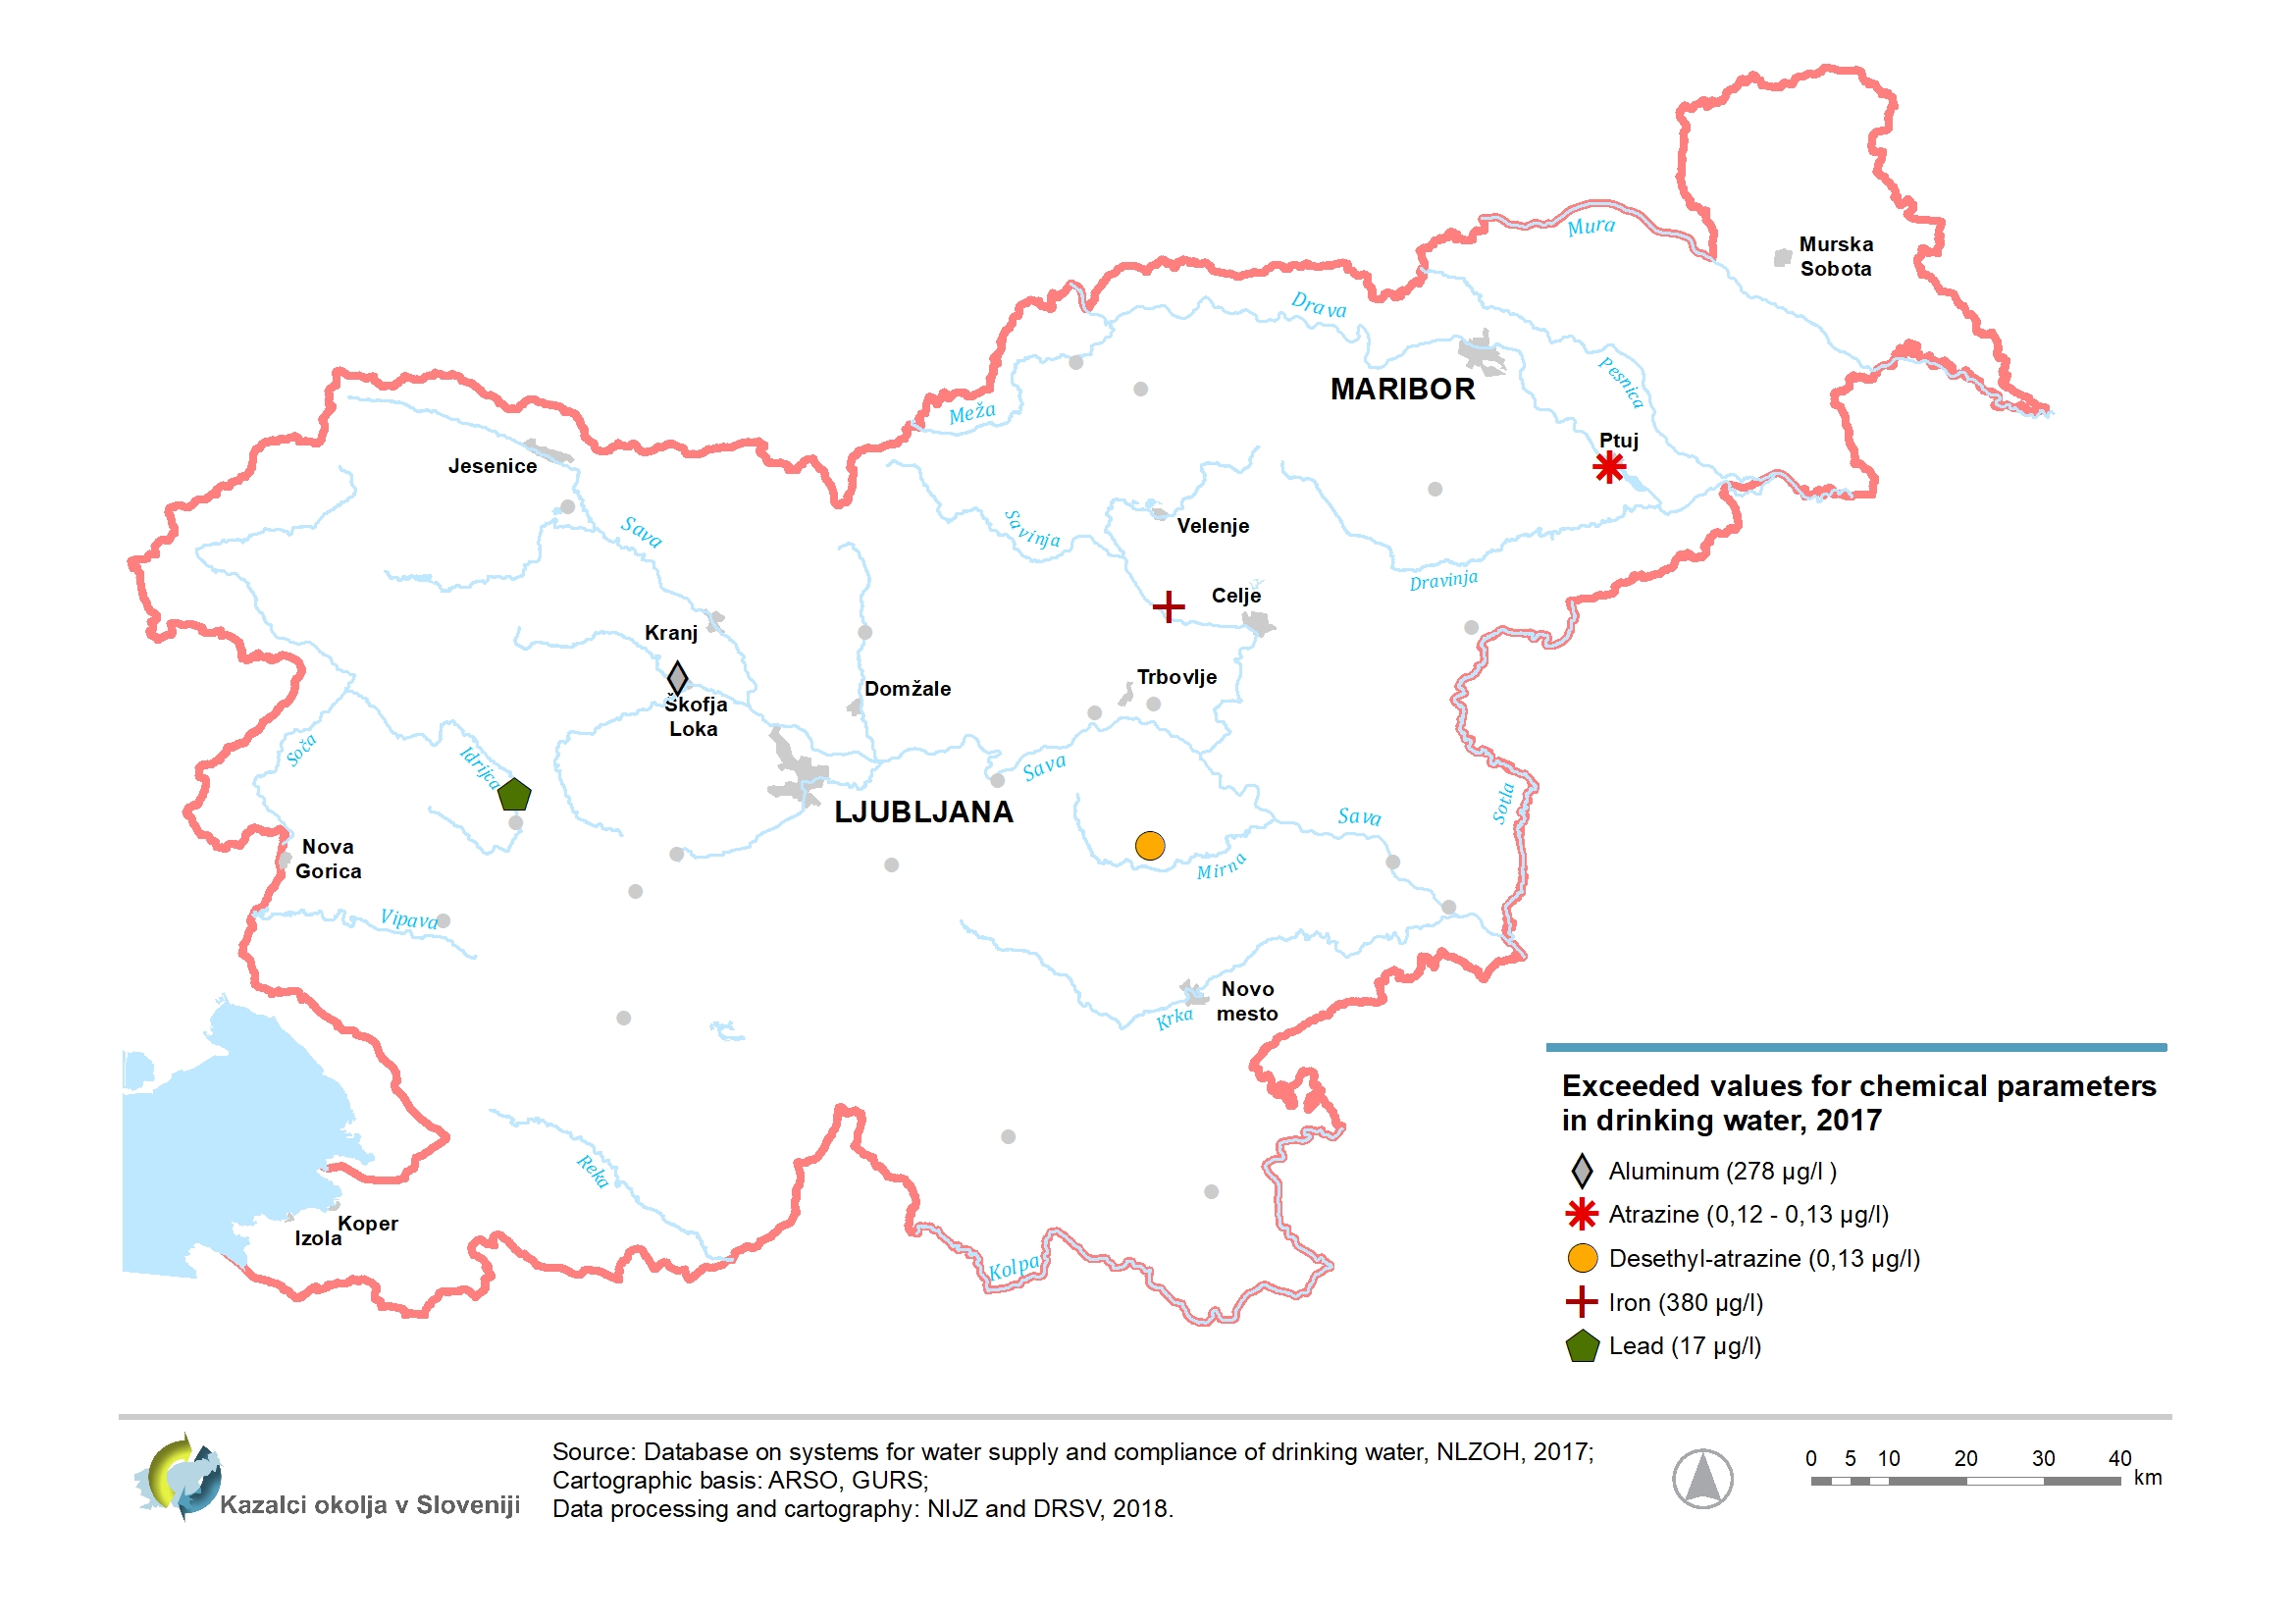
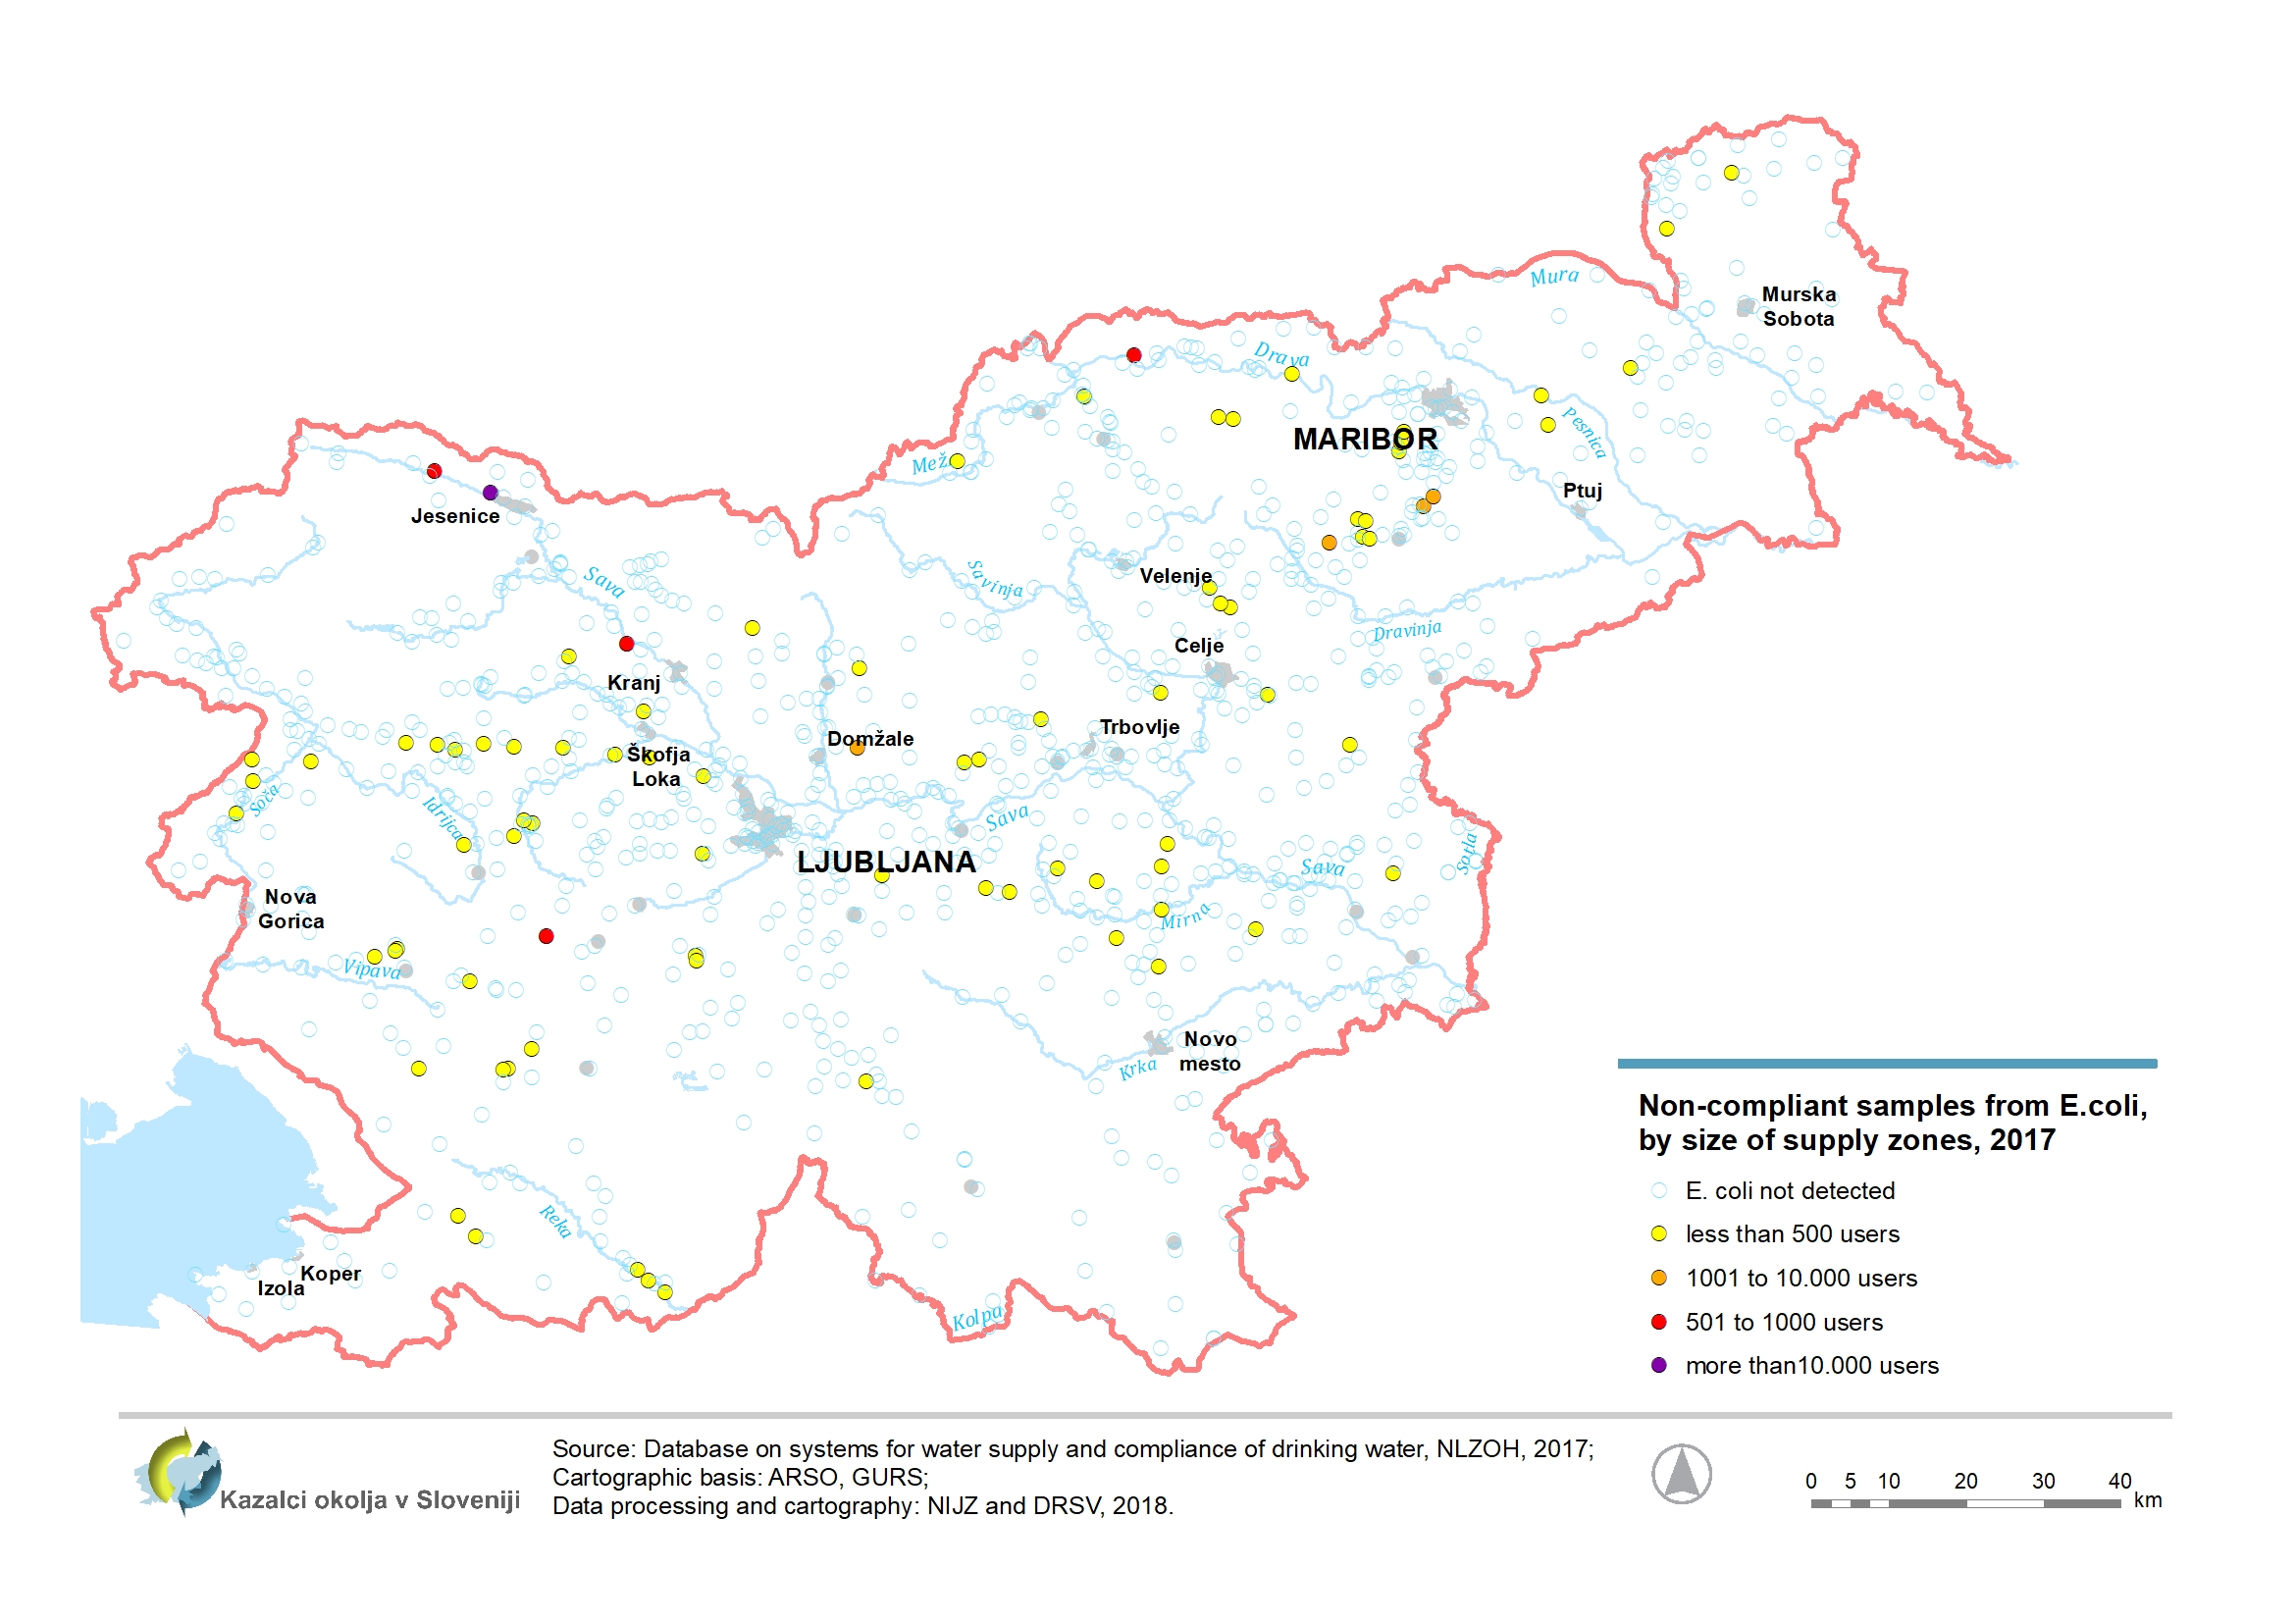
[VD08] Drinking water quality 

Key message

In general, larger supply zones have adequate drinking water quality. The most problematic are small supply zones due to frequent or permanent faecal contamination. Small supply zones are related to zones that cover 50-1.000 residents (most frequently 50-500 residents). Problematic are also some small supply zones with surface water like karst source soft drinking water. The results of chemical analysis indicate contamination of drinking water mostly with pesticides. The monitoring of drinking water does not include systems for drinking water supply serving less than 50 persons. Audit monitoring for determining the chemical parameters were not carried out for about 106.500 residents on systems with 50-500 residents. The quality of drinking water in the period 2004-2017 has slightly improved.
Charts
Institute of Public health, 2005-2008; The Health Insurance Institute Maribor, 2009-2014 ; National Laboratory of Health, Environment and Food, 2014-2018
*Note to table VD8-1:
1-Due to changes in sampling methodology - a different number of samples in each of the years in the size range of 50-500 inhabitants - is not possible to estimate the trend for small supply areas ; improvement can be misleading.
2 For smaller supply areas ( 50 to 500 population) were large differences in the number of samples taken for routine tests , the provisioning area , in individual years : in 2004-2005 were taken after 4 samples , in 2006-2009 one sample from 2010 onwards for 2 samples ; smaller supply areas and will also contribute the majority of non-compliant samples for E. coli.
| Share of non-compliant samples (%) | small (50-1000) | medium (1001-10.000) | big (>10.000) |
|---|---|---|---|
| 2004 | 29 | 6.70 | 2.60 |
| 2005 | 28 | 5.80 | 1.70 |
| 2006 | 24.10 | 4.60 | 0.40 |
| 2007 | 24.50 | 5.30 | 2.10 |
| 2008 | 24.61 | 4.45 | 0.71 |
| 2009 | 19.34 | 4.27 | 1.19 |
| 2010 | 18.89 | 3.68 | 0.51 |
| 2011 | 16 | 1 | 0.80 |
| 2012 | 12.30 | 1.80 | 0.40 |
| 2013 | 8.60 | 1.33 | 0.44 |
| 2014 | 7.87 | 1.11 | 0.17 |
| 2015 | 5.80 | 1.10 | 0.20 |
| 2016 | 5.70 | 1.70 | 0.10 |
| 2017 | 5.39 | 0.61 | 0.10 |
National laboratory of Health, Environment and Food, 2018
| Share of non-compliant samples (%) | small (50-1000) | medium (1001-10.000) | big (>10.000) |
|---|---|---|---|
| Gorenjska | 6.45 | 0 | 1.25 |
| Goriška | 6.25 | 0 | 0 |
| JV Slovenija | 4.55 | 0 | 0 |
| Koroška | 5.61 | 0 | 0 |
| Obalno-kraška | 15 | 0 | 0 |
| Osrednjeslovenska | 4.23 | 1.45 | 0 |
| Podravska | 11.22 | 3.53 | 0 |
| Pomurska | 2.53 | 0 | 0 |
| Posavska | 3.08 | 0 | 0 |
| Primorsko-notranjska | 13.64 | 0 | 0 |
| Savinjska | 2.94 | 0 | 0 |
| Zasavska | 3.85 | 0 | 0 |
| Slovenija | 5.39 | 0.61 | 0.10 |
Institute of Public health, 2005-2008; The Health Insurance Institute Maribor, 2009-2014 ; National Laboratory of Health, Environment and Food, 2014-2018
* Note to the table VD8-3:
1On the small supply areas periodical tests are carried out in the supply areas with 501 - 1000 residents. On supply areas with 50-500 inhabitants periodical tests carried out only in 5-10% of supply areas in the 2006-2010 period - each year on the other , and at 10 % in 2014.
In the years 2004 - 2005 and 2011 - 2013 sporadic trials in supply areas with 50-500 inhabitants are not implemented , and therefore show a trend common in small supply areas is not possible.
2 In 2011, the Monitoring of nitrates or pesticides is carried on the supply areas where in the recent years their presence was detected and there was a possibility that will occur above the 25 mg / loz . 0.05 g / l , so data over the years can not be directly compared.
3 In 2013 and 2017, the monitoring of pesticides has not been implemented in all supply areas , which are otherwise conducted periodic tests of chemical parameters.
| Share of non-compliant samples | small (50-1000) | medium (1001-10.000) | big (>10.000) |
|---|---|---|---|
| 2004 | 10.60 | 2.40 | 7.10 |
| 2005 | 6.70 | 2.90 | 7.60 |
| 2006 | 6.50 | 1.70 | 2.50 |
| 2007 | 7.10 | 2.30 | 1.90 |
| 2008 | 0.61 | 1.14 | 6.83 |
| 2009 | 5.80 | 1.81 | 3 |
| 2010 | 9.20 | 0.43 | 6.95 |
| 2011 | 7.75 | 2.02 | 2.12 |
| 2012 | 4.80 | 3.40 | 2.80 |
| 2013 | 2.80 | 1.33 | 1.83 |
| 2014 | 6.96 | 2.68 | 0.89 |
| 2015 | 5.10 | 1.90 | 1.60 |
| 2016 | 3.90 | 1.20 | 3.60 |
| 2017 | 1.06 | 0.61 | 1.46 |
Institute of Public health, 2005-2008; The Health Insurance Institute Maribor, 2009-2014 ; National Laboratory of Health, Environment and Food, 2014-2018
* Note to Figure VD8-4:
1 Number of inhabitants refers to the supply areas in which a certain pesticide or more pesticides has been exceeded in drinking water.
| Atrazin | Bentazon | Bromacil | Desetil-atrazin | Dikamba | Dimetenamid | Klortoluron | Mekoprop | Metolaklor | Mezotrion | Permetrin | Permetrin | Metazaklor | Diuron | Pesticides - sum | Number of exposed | |
|---|---|---|---|---|---|---|---|---|---|---|---|---|---|---|---|---|
| 2004 | 0.21 | 0 | 0 | 0.29 | 0 | 0.26 | 0 | 0 | 0 | 0 | 0 | 0 | 0 | 0 | 0 | 183881 |
| 2005 | 0.16 | 0.98 | 0 | 0.32 | 0 | 0 | 0 | 0.21 | 0.57 | 0 | 0 | 0.49 | 0 | 0 | 0.93 | 151297 |
| 2006 | 0.18 | 1.40 | 0 | 0.42 | 0 | 0 | 0 | 0 | 0 | 0 | 0 | 0 | 0 | 0 | 1.40 | 36999 |
| 2007 | 0.30 | 0.48 | 0 | 0.30 | 0 | 0 | 0 | 0 | 0 | 0 | 0.21 | 0 | 0 | 0 | 0.55 | 53544 |
| 2008 | 0.20 | 0.40 | 0 | 0.30 | 0 | 0 | 0 | 0 | 0.14 | 0.12 | 0 | 0 | 0 | 0 | 0.66 | 100689 |
| 2009 | 0.15 | 0.37 | 0 | 0.26 | 0.23 | 0 | 0 | 0 | 0.65 | 0 | 0 | 0 | 0 | 0 | 0.65 | 98611 |
| 2010 | 0.19 | 0.14 | 0.16 | 0.41 | 0 | 0 | 0.11 | 0 | 0 | 0 | 0 | 0 | 0 | 0 | 0.56 | 183690 |
| 2011 | 0.21 | 0.12 | 0 | 0.42 | 0 | 0 | 0 | 0 | 0.13 | 0 | 0 | 0 | 0.12 | 0 | 0 | 83996 |
| 2012 | 0.19 | 0 | 0 | 0.25 | 0 | 0 | 0 | 0 | 0.21 | 0 | 0 | 0.16 | 0 | 0 | 0 | 105443 |
| 2013 | 0.21 | 0 | 0 | 0.58 | 0 | 0 | 0 | 0 | 0 | 0 | 0 | 0 | 0 | 0 | 0.64 | 21686 |
| 2014 | 0.21 | 0 | 0 | 0.29 | 0 | 0 | 0 | 0 | 0 | 0 | 0 | 0 | 0.27 | 0 | 0.51 | 6512 |
| 2015 | 0.22 | 0.36 | 0.27 | 0.52 | 33975 | |||||||||||
| 2016 | 0.10 | 0 | 0 | 0.14 | 0 | 0 | 0 | 0 | 0 | 0 | 0 | 0 | 0 | 0 | 0 | 29400 |
| 2017 | 0.14 | 0.65 | 0 | 0.13 | 0 | 0 | 0 | 0 | 0 | 0 | 0 | 0 | 0 | 0 | 0 | 28869 |
Institute of Public health, 2005-2008; The Health Insurance Institute Maribor, 2009-2014 ; National Laboratory of Health, Environment and Food, 2014-2018
* Note to Figure VD8-5:
1 Number of inhabitants refers to the supply areas in which nitrates have been exceeded in drinking water.
| Number of inhabitants | |
|---|---|
| 1995 | 112498 |
| 1996 | 89928 |
| 1997 | 22969 |
| 1998 | 1813 |
| 1999 | 2390 |
| 2000 | 1835 |
| 2001 | 3530 |
| 2002 | 3716 |
| 2003 | 15518 |
| 2004 | 12243 |
| 2005 | 4046 |
| 2006 | 34321 |
| 2007 | 3555 |
| 2008 | 4022 |
| 2009 | 4898 |
| 2010 | 3327 |
| 2011 | 3404 |
| 2012 | 2862 |
| 2013 | 2862 |
| 2014 | 3047 |
| 2015 | 2862 |
| 2016 | 0 |
| 2017 | 0 |


