


[VD08] Drinking water quality 
Key message
In 2023, drinking water monitoring was carried out in supply zones (water supply systems) that supply 50 or more persons (92.3% of the population). Large, medium and some of small supply zones that supply more than 500 (87.7%) inhabitants, generally have adequate drinking water quality. The smallest supply zones that supply 50-500 inhabitants are the least regulated, in comparison to larger due to the fecal contamination, as some with karst water resources. The results of chemical analysis exceeded limit value of the pesticide desethyl-atrazine, bentazone and chemical parameter lead and iron. In the period 2004-2023, the quality of drinking water has improved, mainly due to the nitrates and pesticides.
Charts
Monitoring pitne vode. Porocilo o pitni vodi v Republiki Sloveniji (IVZ, 2005-2008) in Zbirka podatkov o sistemih za oskrbo s pitno vodo in o skladnosti pitne vode (ZZV MB, 2009-2013; NLOZH, 2014-2024).
1- Due to changes in sampling methodology - a different number of samples in each of the years in the size range of 50-500 inhabitants is not possible to estimate the trend for small supply zone, 2004-2023.
2- For smaller supply zone (50-500 inhabitants) were large differences in the number of samples taken for check monitoring, in individual years: in 2004-2005 were 4-5 samples, in 2006-2009 one sample, in 2010 2 samples; smaller supply zone with 50-500 inhabitant contribute the majority of non-compliant samples for E. coli.
| THE SMALLEST (50-500)[%] | SMALL (501-1.000)[%] | TOTAL SMALL (50-1.000)[%] | MEDIUM (1.001-10.000)[%] | LARGE (>10.000)[%] | total[%] | |
|---|---|---|---|---|---|---|
| 2004 | 33.20 | 12.90 | 29 | 6.70 | 2.60 | 19 |
| 2005 | 32 | 12.20 | 28 | 5.80 | 1.70 | 18.40 |
| 2006 | 30.80 | 11.20 | 24.10 | 4.60 | 0.40 | 10.30 |
| 2007 | 30.90 | 12.10 | 24.50 | 5.30 | 2.10 | 10.90 |
| 2008 | 34.40 | 7.90 | 24.60 | 4.40 | 0.70 | 10.30 |
| 2009 | 26.30 | 7.60 | 19.30 | 4.30 | 1.20 | 8.50 |
| 2010 | 24.30 | 6.60 | 18.90 | 3.70 | 0.50 | 9 |
| 2011 | 20.40 | 3.40 | 16 | 1 | 0.80 | 7.60 |
| 2012 | 15.70 | 2.80 | 12.30 | 1.80 | 0.40 | 6.70 |
| 2013 | 10.40 | 2.80 | 8.60 | 1.30 | 0.40 | 4.30 |
| 2014 | 10.40 | 1.50 | 7.90 | 1.10 | 0.20 | 3.70 |
| 2015 | 7.60 | 2 | 5.80 | 1.10 | 0.20 | 3 |
| 2016 | 7.30 | 1.30 | 5.70 | 1.70 | 0.10 | 3.10 |
| 2017 | 6.80 | 1.10 | 5.40 | 0.60 | 0.10 | 2.80 |
| 2018 | 5.20 | 0.80 | 4.10 | 0.80 | 0 | 2.10 |
| 2019 | 4.50 | 0 | 3.40 | 0.50 | 0.10 | 1.70 |
| 2020 | 5.60 | 0.40 | 4.60 | 0.80 | 0.10 | 2.60 |
| 2021 | 4.10 | 0.40 | 3.40 | 0 | 0 | 1.80 |
| 2022 | 5.40 | 1.10 | 4.60 | 0.60 | 0.20 | 2.60 |
| 2023 | 4.90 | 0.40 | 4 | 0.60 | 0.20 | 2.30 |
Zbirka podatkov o sistemih za oskrbo s pitno vodo in o skladnosti pitne vode 2023 (NLZOH, 2024). (2025)
| THE SMALLEST (50-500)[%] | SMALL (501-1.000)[%] | TOTAL SMALL (50-1.000)[%] | MEDIUM (1.001-10.000)[%] | LARGE (>10.000)[%] | total[%] | |
|---|---|---|---|---|---|---|
| Slovenija | 4.90 | 0.40 | 4 | 0.60 | 0.20 | 2.30 |
| Zasavska | 8.30 | 0 | 5.60 | 3.10 | 0 | 4.80 |
| Savinjska | 4 | 2.60 | 3.70 | 0 | 0 | 1.90 |
| Primorsko-notranjska | 7.50 | 0 | 7.50 | 0 | 0 | 3.10 |
| Posavska | 5.20 | 0 | 4.20 | 0 | 0 | 2.90 |
| Pomurska | 5.70 | 0 | 4.40 | 0 | 0 | 1.80 |
| Podravska | 9.20 | 0 | 8.70 | 3.30 | 0 | 3.60 |
| Osrednjeslovenska | 5 | 0 | 3.80 | 0 | 0 | 1.50 |
| Obalno-kraška | 31.30 | 0 | 26.30 | 0 | 0 | 5.70 |
| Koroška | 0 | 0 | 0 | 0 | 0 | 0 |
| JV Slovenija | 2.30 | 0 | 1.90 | 0 | 0 | 0.90 |
| Goriška | 4.50 | 0 | 3.70 | 0 | 0 | 2.80 |
| Gorenjska | 1.90 | 0 | 1.60 | 0 | 2.90 | 1.60 |

Zbirka podatkov o sistemih za oskrbo s pitno vodo in o skladnosti pitne vode za leto 2023. Nacionalni laboratorij za zdravje, okolje in hrano (NLZOH), 2024; podlage Agencija RS za okolje, GURS; Obdelava: Nacionalni inštitut za javno zdravje (NIJZ), 2024
IVZ RS, 2005 - 2008; ZZV MB, 2009-2013; NLZOH, 2014-2024 (2025)
In 2023, on the small supply zone audit monitoring are carried out in the supply areas with 501 - 1000 inhabitants and also in the supply areas with 50-500 but only for 90 supply zones (10,5 %).
On supply areas with 50-500 inhabitants audit monitoring carried out only in 5-10% of supply areas in the 2006-2010 period - each year on the other, and at 10 % in 2014-2016.
In the years 2004-2005 and 2011-2013 and 2017-2019 audit monitoring in supply zones with 50-500 inhabitants are not carried out.
| SMALL (50-1.000)[%] | MEDIUM (1.001-10.000)[%] | LARGE (>10.000)[%] | total[%] | |
|---|---|---|---|---|
| 2004 | 10.60 | 2.40 | 7.10 | 5.60 |
| 2005 | 6.70 | 2.90 | 7.60 | 5.30 |
| 2006 | 6.50 | 1.70 | 2.50 | 3.30 |
| 2007 | 7.10 | 2.30 | 1.90 | 3.50 |
| 2008 | 0.60 | 1.10 | 6.80 | 2.80 |
| 2009 | 5.80 | 1.80 | 3 | 3.20 |
| 2010 | 9.20 | 0.40 | 7 | 5.10 |
| 2011 | 7.70 | 2 | 2.10 | 3.40 |
| 2012 | 4.80 | 3.40 | 2.80 | 3.60 |
| 2013 | 2.80 | 1.30 | 1.80 | 1.90 |
| 2014 | 7 | 2.70 | 0.90 | 3.80 |
| 2015 | 5.10 | 1.90 | 1.60 | 3.10 |
| 2016 | 3.90 | 1.20 | 3.60 | 2.90 |
| 2017 | 1.10 | 0.60 | 1.50 | 1 |
| 2018 | 0 | 1.80 | 1.40 | 1.30 |
| 2019 | 2.20 | 0 | 0 | 0.50 |
| 2020 | 0.80 | 0 | 0 | 0.40 |
| 2021 | 2.20 | 0.60 | 0.80 | 1 |
| 2022 | 1.10 | 0 | 0 | 0.30 |
| 2023 | 2.20 | 0 | 0 | 0.50 |
IVZ, 2005-2008; ZZV MB, 2009-2013; NLZOH, 2014-2024 (2025)
| [µg/l] | [µg/l] | [µg/l] | [µg/l] | [µg/l] | [µg/l] | [µg/l] | [µg/l] | [µg/l] | [µg/l] | [µg/l] | [µg/l] | [µg/l] | [µg/l] | [µg/l] | ||
|---|---|---|---|---|---|---|---|---|---|---|---|---|---|---|---|---|
| 2004 | 0.21 | 0.29 | 0.26 | 183881 | ||||||||||||
| 2005 | 0.16 | 0.98 | 0.32 | 0.21 | 0.57 | 0.49 | 0.93 | 151297 | ||||||||
| 2006 | 0.18 | 1.40 | 0.42 | 1.40 | 36999 | |||||||||||
| 2007 | 0.30 | 0.48 | 0.30 | 0.21 | 0.55 | 53544 | ||||||||||
| 2008 | 0.20 | 0.40 | 0.30 | 0.14 | 0.12 | 0.66 | 100689 | |||||||||
| 2009 | 0.15 | 0.37 | 0.26 | 0.23 | 0.65 | 0.66 | 98611 | |||||||||
| 2010 | 0.19 | 0.14 | 0.16 | 0.41 | 0.11 | 0.56 | 183690 | |||||||||
| 2011 | 0.21 | 0.12 | 0.42 | 0.13 | 0.12 | 83996 | ||||||||||
| 2012 | 0.19 | 0.25 | 0.21 | 0.16 | 105443 | |||||||||||
| 2013 | 0.21 | 0.58 | 0.64 | 21686 | ||||||||||||
| 2014 | 0.21 | 0.29 | 0.27 | 0.51 | 6512 | |||||||||||
| 2015 | 0.22 | 0.36 | 0.27 | 0.52 | 33975 | |||||||||||
| 2016 | 0.10 | 0.14 | 29400 | |||||||||||||
| 2017 | 0.14 | 0.65 | 0.13 | 288869 | ||||||||||||
| 2018 | 0.37 | 0.12 | 1533 | |||||||||||||
| 2019 | 0.15 | 1130 | ||||||||||||||
| 2020 | 0.11 | 0.20 | 1230 | |||||||||||||
| 2021 | 0.10 | 0.12 | 0.80 | 28780 | ||||||||||||
| 2022 | 0.13 | 580 | ||||||||||||||
| 2023 | 0.45 | 0.14 | 680 |
15/1290 (13/05/2015)
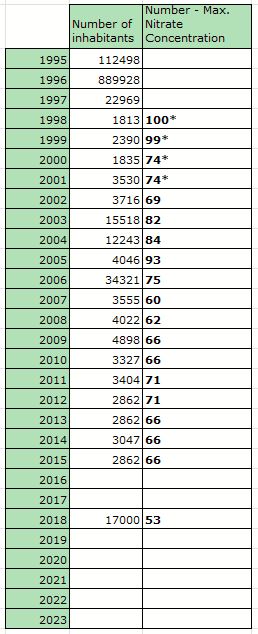
Number of inhabitants refers to the supply zone in which nitrates have been exceeded in drinking water.


Methodology
- Agenda 2030, 2015. Spremenimo svet: Agenda za trajnostni razvoj do leta 2030. Organizacija Združenih narodov, 2015.
- Directive (EU) 2020/2184 on the quality of water intended for human consumption (OJ of the EU, L 330, 5.12.1998, p. 32–54).
- Commission Directive (EU) 2015/1787 of 6 October 2015 amending Annexes II and III to Council Directive 98/83/EC on the quality of water intended for human consumption; Official Journal of the European Union L260/6.
- Guidelines for drinking-water quality: fourth edition incorporating the first Addendum. Geneva: World Health Organization; 2017
- IVZ RS, 2005. Monitoring pitne vode 2004: Poročilo o pitni vodi v Republiki Sloveniji. Inštitut za varovanje zdravja Republike Slovenije. Ljubljana, maj 2005.
- IVZ RS, 2006. Monitoring pitne vode 2005: Poročilo o pitni vodi v Republiki Sloveniji. Inštitut za varovanje zdravja Republike Slovenije, Ljubljana, maj 2006.
- IVZ RS, 2007. Monitoring pitne vode 2006: Poročilo o pitni vodi v Republiki Sloveniji. Inštitut za varovanje zdravja Republike Slovenije. Ljubljana, maj 2007.
- IVZ RS, 2008. Monitoring pitne vode 2007. Poročilo o pitni vodi v Republiki Sloveniji. Inštitut za varovanje zdravja Republike Slovenije, Ljubljana, julij 2008.
- Ministrstvo za okolje in prostor. Operativni program oskrbe s pitno vodo za obdobje od 2015 do 2020, Ljubljana 2015.
- NLZOH, 2014. Zbirka podatkov o sistemih za oskrbo s pitno vodo in o skladnosti pitne vode, 2013.
- NLZOH, 2015. Zbirka podatkov o sistemih za oskrbo s pitno vodo in o skladnosti pitne vode, 2014.
- NLZOH, 2016. Zbirka podatkov o sistemih za oskrbo s pitno vodo in o skladnosti pitne vode, 2015.
- NLZOH, 2017. Zbirka podatkov o sistemih za oskrbo s pitno vodo in o skladnosti pitne vode, 2016.
- NLZOH, 2018. Zbirka podatkov o sistemih za oskrbo s pitno vodo in o skladnosti pitne vode, 2017.
- NLZOH, 2019. Zbirka podatkov o sistemih za oskrbo s pitno vodo in o skladnosti pitne vode, 2018.
- NLZOH, 2020. Zbirka podatkov o sistemih za oskrbo s pitno vodo in o skladnosti pitne vode, 2019.
- NLZOH, 2022. Zbirka podatkov o sistemih za oskrbo s pitno vodo in o skladnosti pitne vode, 2021.
- NLZOH, 2023. Zbirka podatkov o sistemih za oskrbo s pitno vodo in o skladnosti pitne vode, 2022.
- Pravilnik o pitni vodi (Uradni list RS, št. 19/04, 35/04, 26/06, 92/06, 25/09, 74/15 in 51/17).
- SRS, 2017. Strategija razvoja Slovenije 2030. Ljubljana : Služba Vlade Republike Slovenije za razvoj in evropsko kohezijsko politiko, 2017.
- Strategija Republike Slovenije za zdravje otrok in mladostnikov v povezavi z okoljem 2012–2020. Sprejela Vlada Republike Slovenije, s sklepom št. 02401-13/2010/5, z dne 1.12.2011.
- Vlada RS, 2023. Operativni program oskrbe s pitno vodo 2022-2027.
- ZZV MB, 2009. Zbirka podatkov o sistemih za oskrbo s pitno vodo in o skladnosti pitne vode, 2008.
- ZZV MB, 2010. Zbirka podatkov o sistemih za oskrbo s pitno vodo in o skladnosti pitne vode, 2009.
- ZZV MB, 2011. Zbirka podatkov o sistemih za oskrbo s pitno vodo in o skladnosti pitne vode, 2010.
- ZZV MB, 2012. Zbirka podatkov o sistemih za oskrbo s pitno vodo in o skladnosti pitne vode, 2011.
- ZZV MB, 2013. Zbirka podatkov o sistemih za oskrbo s pitno vodo in o skladnosti pitne vode, 2012.
- Letopis NIJZ, 2024. Zdravstveni statistični letopis Slovenije. https://nijz.si/podatki/zdravstveni-statisticni-letopis-slovenije/.