[VD08] Drinking water quality 

Key message

Charts
Drinking Water Supply Systems Database, Institute of Public Health, 1999, 2000, 2001, 2002, 2003 and Drinking Water Supply Systems and Drinking water accordance Database 2004-2007.
| 1999 | 2000 | 2001 | 2002 | 2003 | 2004 | 2005 | 2006 | 2007 | ||
|---|---|---|---|---|---|---|---|---|---|---|
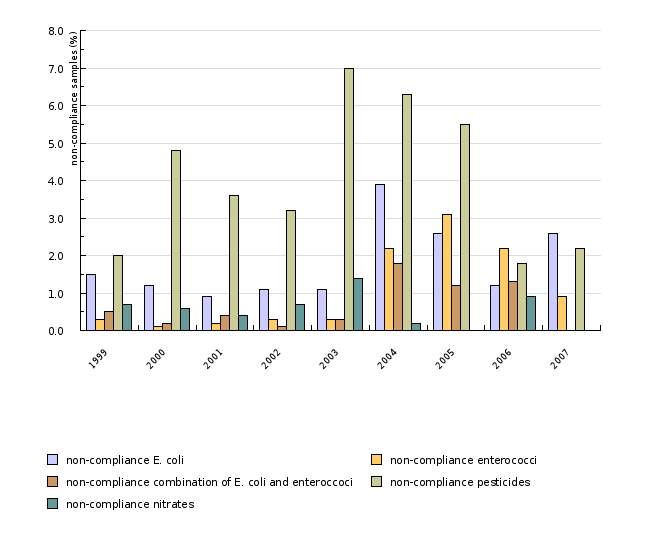
| non-compliance E. coli | % | 1.5 | 1.2 | 0.9 | 1.1 | 1.1 | 3.9 | 2.6 | 1.2 | 2.6 |
| non-compliance enterococci | % | 0.3 | 0.1 | 0.2 | 0.3 | 0.3 | 2.2 | 3.1 | 2.2 | 0.9 |
| non-compliance combination of E. coli and enteroccoci | % | 0.5 | 0.2 | 0.4 | 0.1 | 0.3 | 1.8 | 1.2 | 1.3 | 0 |
| non-compliance pesticides | % | 2 | 4.8 | 3.6 | 3.2 | 7 | 6.3 | 5.5 | 1.8 | 2.2 |
| non-compliance nitrates | % | 0.7 | 0.6 | 0.4 | 0.7 | 1.4 | 0.2 | 0 | 0.9 | 0 |
Drinking Water Supply Systems Database, Institute of Public Health, 1999, 2000, 2001, 2002, 2003 and Drinking Water Supply Systems and Drinking water accordance Database 2004-2007
| 1999 | 2000 | 2001 | 2002 | 2003 | 2004 | 2005 | 2006 | 2007 | ||
|---|---|---|---|---|---|---|---|---|---|---|
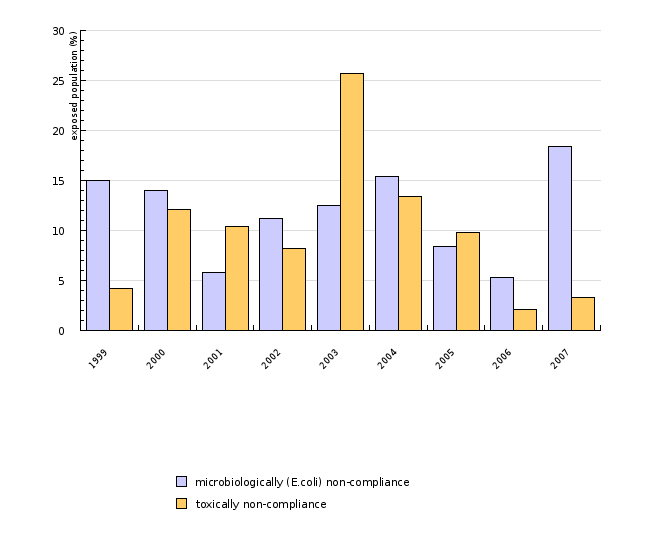
| microbiologically (E.coli) non-compliance | number | 209919 | 204260 | 84798 | 168277 | 184503 | 215296 | 117043 | 74945 | 260293 |
| toxically non-compliance | number | 58740 | 176677 | 150695 | 123654 | 380213 | 188059 | 137745 | 30163 | 47034 |
| all inhabitants | number | 1398137 | 1455981 | 1452773 | 1505618 | 1481524 | 1402502 | 1400675 | 1414552 | 1414041 |
| microbiologically (E.coli) non-compliance | % | 15 | 14 | 6 | 11 | 12 | 15 | 8 | 5 | 18 |
| toxically non-compliance | % | 4 | 12 | 10 | 8 | 26 | 13 | 10 | 2 | 3 |
Drinking Water Supply Systems Database, Institute of Public Health, 1999, 2000, 2001, 2002, 2003 and Drinking Water Supply Systems and Drinking water accordance Database 2004-2007
| 1999 | 2000 | 2001 | 2002 | 2003 | 2004 | 2005 | 2006 | 2007 | ||
|---|---|---|---|---|---|---|---|---|---|---|
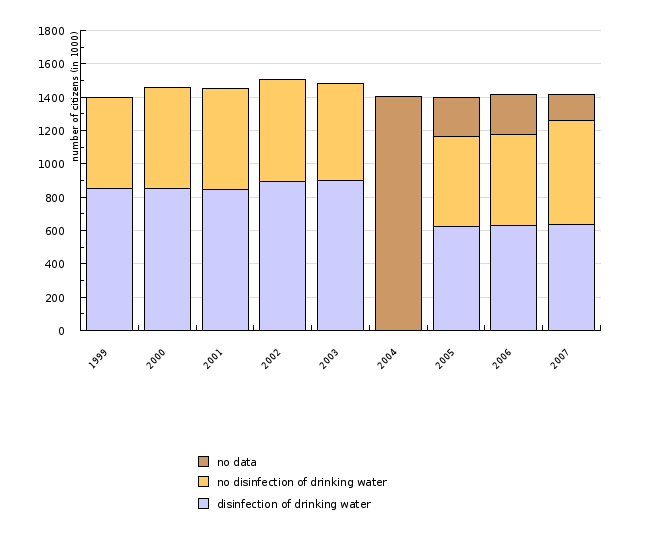
| total | number (in 1000) | 1398 | 1456 | 1453 | 1506 | 1482 | 1402 | 1401 | 1414 | 1414 |
| disinfection of drinking water | number (in 1000) | 854 | 852 | 848 | 894 | 900 | - | 623 | 631 | 638 |
| no disinfection of drinking water | number (in 1000) | 545 | 604 | 604 | 611 | 581 | - | 544 | 544 | 624 |
| no data | number (in 1000) | - | - | - | - | - | 1402 | 234 | 239 | 152 |
Drinking Water Supply Systems and Drinking water accordance Database 2004-2007, Institute of Public Health of the Republic of Slovenia
| 2004 | 2005 | 2006 | 2007 | ||
|---|---|---|---|---|---|
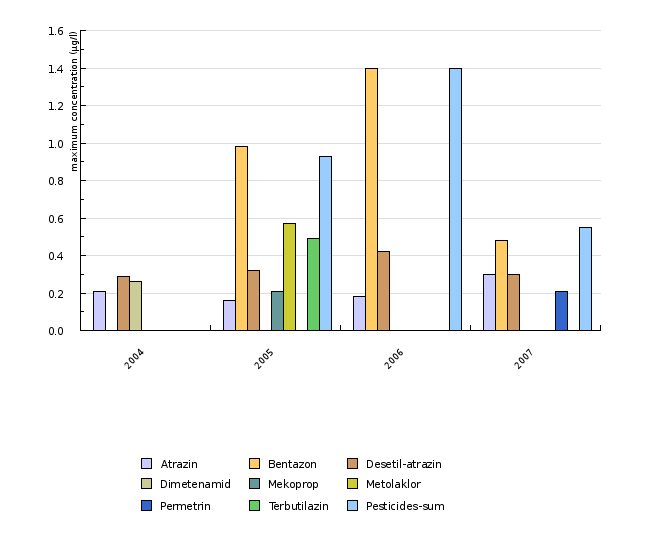
| Atrazin | µg/l | 0.21 | 0.16 | 0.18 | 0.3 |
| Bentazon | µg/l | - | 0.98 | 1.4 | 0.48 |
| Desetil-atrazin | µg/l | 0.29 | 0.32 | 0.42 | 0.3 |
| Dimetenamid | µg/l | 0.26 | - | - | - |
| Mekoprop | µg/l | - | 0.21 | - | - |
| Metolaklor | µg/l | - | 0.57 | - | - |
| Permetrin | µg/l | - | - | - | 0.21 |
| Terbutilazin | µg/l | - | 0.49 | - | - |
| Pesticides-sum | µg/l | - | 0.93 | 1.4 | 0.55 |
| numbrer of inhabitants | število | 183881 | 151297 | 36999 | 53544 |
Goals
The objective is to establish the actual state in the field of drinking water supply in Slovenia, determine the values and trends of microbiological and physical-chemical parameters for the assessment of health suitability of drinking water, and propose general measures for the improvement of drinking water quality.


