[VD08] Drinking water quality 

Key message

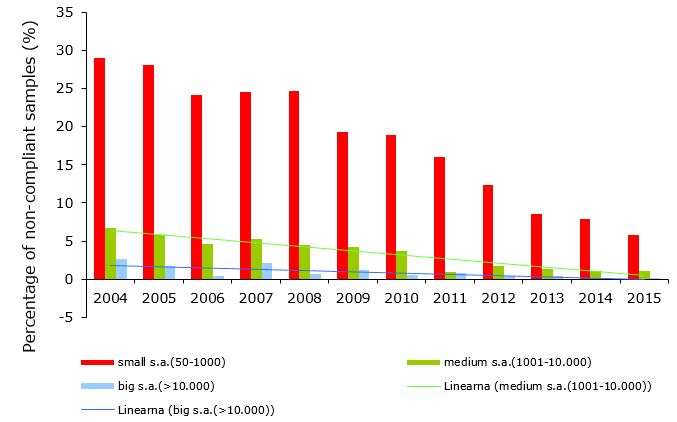
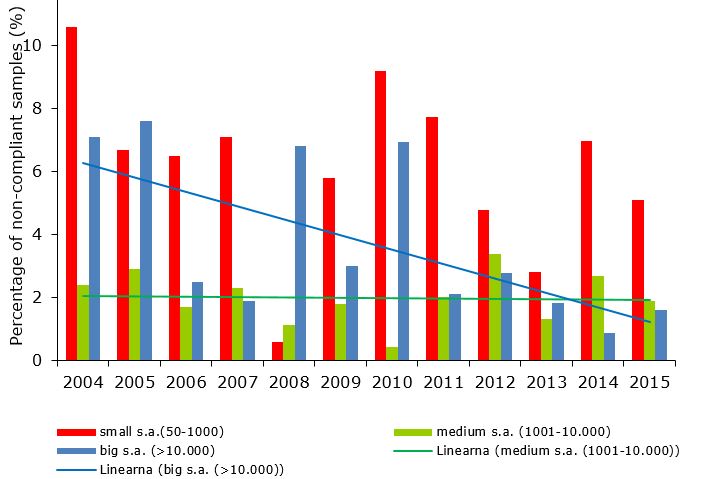
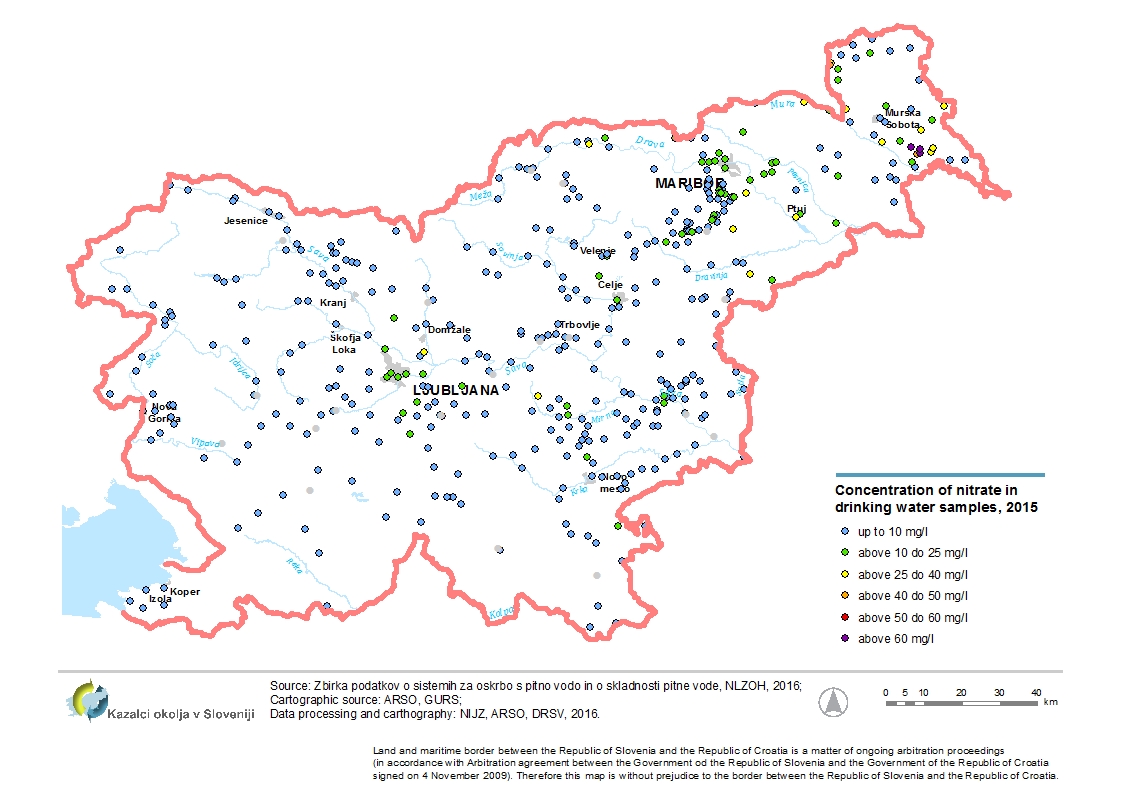
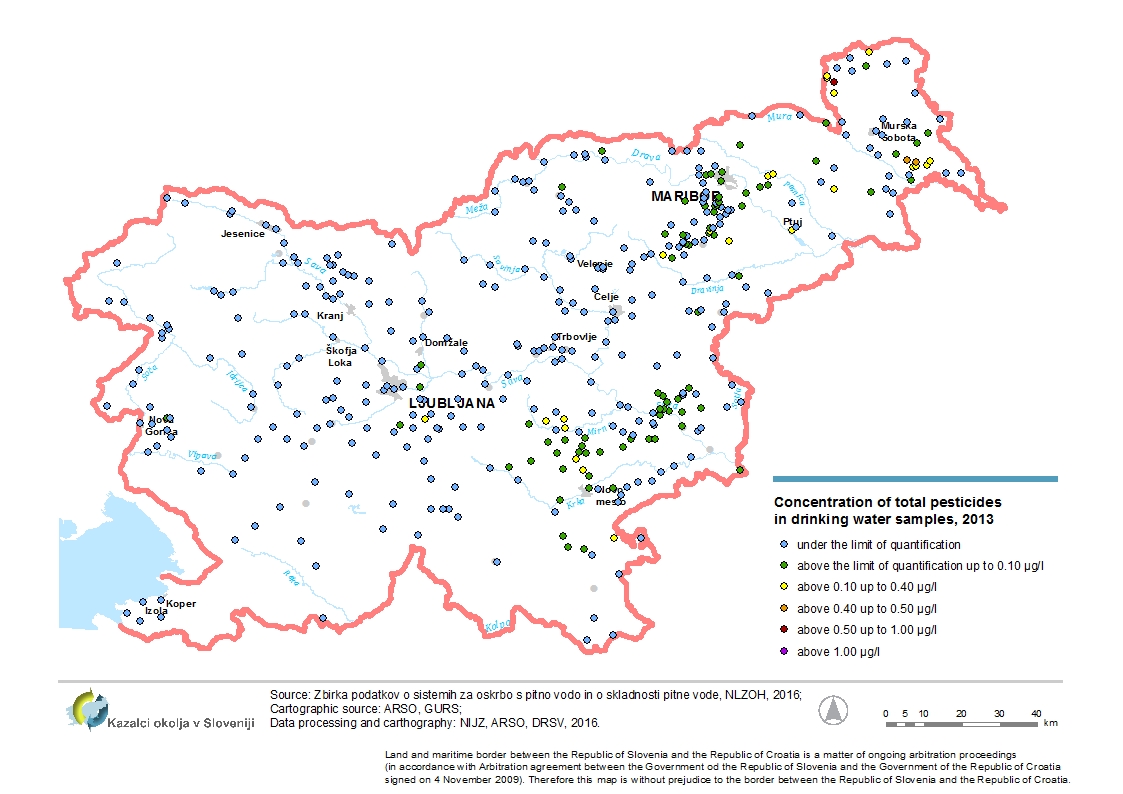
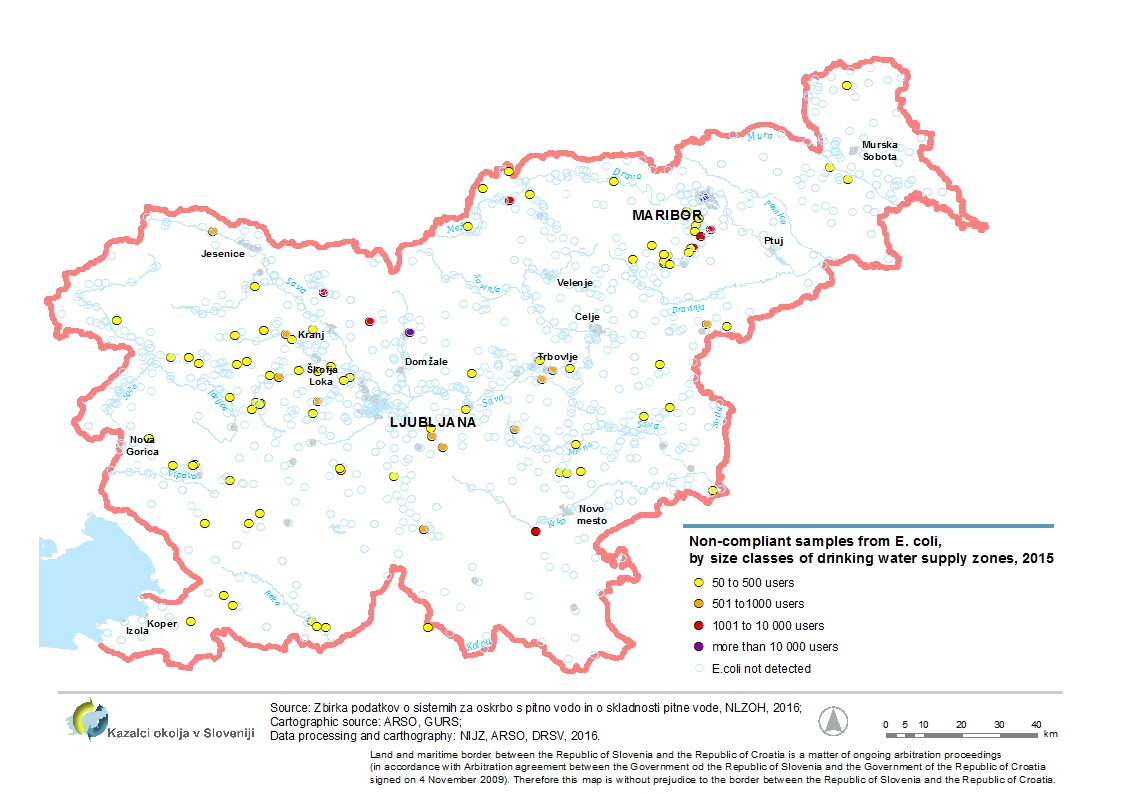
Large and medium supply areas, which supply more than 1,000 people (85 % of the population), generally have adequate quality of drinking water. Out of these, one fifth of population is supplied with drinking water, which does not need preparation. From health prevention point of view, the most uncontrolled are the small supply areas, which supply 50-1,000 people (mainly areas with 50-500 people) because they are polluted with faeces. Similar applies for areas, which are supplied with surface water, which from health risk point of view include karst sources of drinking water. The results of chemical tests show that drinking water is polluted with pesticides and nitrates. Drinking water quality monitoring does not include the population who are supplied by drinking water supply systems for less than 50 persons, so the quality of drinking water for this population is not known (app. 134,000 population in 2015). According to parameters, important for population health, chemical quality for year 2015 is not known for approximately 218,000 Slovenian population. The quality of drinking water did not improve significantly in the period 2004-2015.
Charts
Insitute of Public health, 2005-2008; The Health Insurance Institute Maribor, 2009-2014 ; National Laboratory of Health, Environment and Food, 2014-2016
Note to table VD08-1*
1 Due to changes in sampling methodology - a different number of samples in each of the years in the size range of 50-500 inhabitants - is not possible to estimate the trend for small supply areas ; improvement can be misleading.
2 For smaller supply areas ( 50 to 500 population) were large differences in the number of samples taken for routine tests , the provisioning area , in individual years : in 2004-2005 were taken after 4 samples , in 2006-2009 one sample from 2010 onwards for 2 sample ; smaller supply areas and will also contribute the majority of non-compliant samples for E. coli.
| 2005 | 2006 | 2007 | 2008 | 2009 | 2010 | 2011 | 2012 | 2013 | 2014 | ||
|---|---|---|---|---|---|---|---|---|---|---|---|
| small (50-1000) | % | 28 | 24.1 | 24.5 | 24.6 | 19.3 | 18.9 | 16 | 12.3 | 8.6 | 7.9 |
| medium (1001-10.000) | % | 5.8 | 4.6 | 5.3 | 4.4 | 4.3 | 3.7 | 1 | 1.8 | 1.3 | 1.1 |
| big (>10.000) | % | 1.7 | 0.4 | 2.1 | 0.7 | 1.2 | 0.5 | 0.8 | 0.4 | 0.4 | 0.2 |
| total | % | 18.4 | 10.3 | 10.9 | 10.3 | 8.5 | 9 | 7.6 | 6.7 | 4.3 | 3.7 |
| 2015 | |||||||||||
| small (50-1000) | % | 5.8 | |||||||||
| medium (1001-10.000) | % | 1.1 | |||||||||
| big (>10.000) | % | 0.2 | |||||||||
| total | % | 3 |
NLZOH, 2016
| pomurska | osrednjeslovenska | obalno-kraška | goriška | primorsko-notranjska | savinjska | JV Slo | podravska | posavska | gorenjska | ||
|---|---|---|---|---|---|---|---|---|---|---|---|
| big (>10.000) | nmb. | 0 | 0.3 | 0 | 0 | 0 | 0 | 0 | 0.6 | 0 | 0 |
| medium (1001-10.000) | % | 0 | 0 | 0 | 0 | 0 | 1.3 | 2.8 | 0 | 2.2 | |
| small (50-1000) | nmb. | 2.1 | 5.7 | 23.8 | 4.6 | 14 | 2.9 | 5.4 | 14 | 2.5 | 10.3 |
| total | nmb. | 1.1 | 2 | 4.7 | 3.1 | 5.4 | 1.3 | 2.5 | 4.7 | 1.8 | 5.9 |
| zasavska | koroška | Slovenia | |||||||||
| big (>10.000) | nmb. | 0 | 0.2 | ||||||||
| medium (1001-10.000) | % | 5 | 1.4 | 1.1 | |||||||
| small (50-1000) | nmb. | 3.7 | 4.6 | 5.8 | |||||||
| total | nmb. | 3.6 | 3.3 | 3 |
Insitute of Public health, 2005-2008; The Health Insurance Institute Maribor, 2009-2014 ; National Laboratory of Health, Environment and Food, 2014-2016
Note to table VD08-3
1 On the small supply areas periodical tests are carried out in the supply areas with 501 - 1000 residents. On supply areas with 50-500 inhabitants periodical tests carried out only in 5-10% of supply areas in the 2006-2010 period - each year on the other , and at 10 % in 2014.
In the years 2004 - 2005 and 2011 - 2013 sporadic trials in supply areas with 50-500 inhabitants are not implemented , and therefore show a trend common in small supply areas is not possible.
2 In 2011, the Monitoring of nitrates or pesticides is carried on the supply areas where in the recent years their presence was detected and there was a possibility that will occur above the 25 mg / loz . 0.05 g / l , so data over the years can not be directly compared.
3 In 2013 and 2014, the monitoring of pesticides has not been implemented in all supply areas , which are otherwise conducted periodic tests of chemical parameters.
Insitute of Public health, 2005-2008; The Health Insurance Institute Maribor, 2009-2014 ; National Laboratory of Health, Environment and Food, 2014-2016
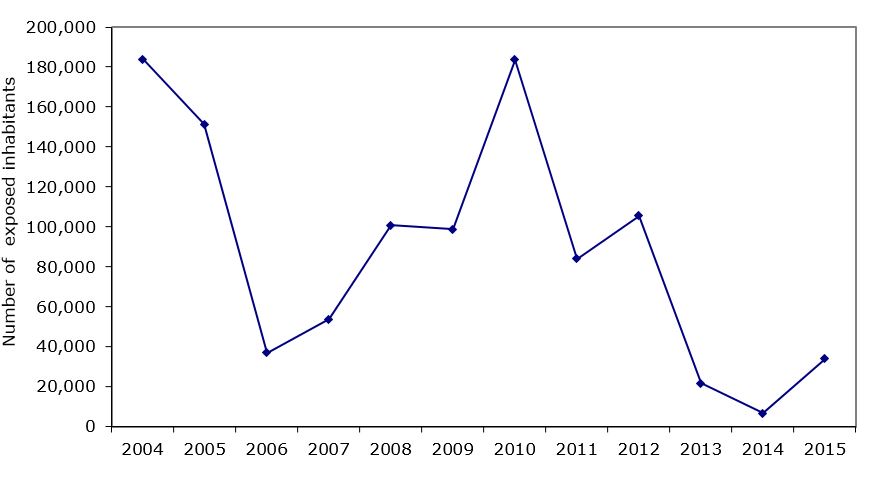
*Note to table VD8-4: Number of inhabitants refers to the supply areas in which a certain pesticide or more pesticides has been exceeded in drinking water.
| 2004 | 2005 | 2006 | 2007 | 2008 | 2009 | 2010 | 2011 | 2012 | 2013 | ||
|---|---|---|---|---|---|---|---|---|---|---|---|
| µg/l | 0.2 | 0.2 | 0.2 | 0.3 | 0.2 | 0.2 | 0.2 | 0.2 | 0.2 | 0.2 | |
| µg/l | - | 1 | 1.4 | 0.5 | 0.4 | 0.4 | 0.1 | 0.1 | - | - | |
| µg/l | - | - | - | - | - | - | 0.2 | - | - | - | |
| µg/l | 0.3 | 0.3 | 0.4 | 0.3 | 0.3 | 0.3 | 0.4 | 0.4 | 0.2 | 0.6 | |
| µg/l | - | - | - | - | - | 0.2 | - | - | - | - | |
| µg/l | 0.3 | - | - | - | - | - | - | - | - | - | |
| µg/l | - | - | - | - | - | - | 0.1 | - | - | - | |
| µg/l | - | 0.2 | - | - | - | - | - | - | - | - | |
| µg/l | - | 0.6 | - | - | 0.1 | 0.7 | - | 0.1 | 0.2 | - | |
| µg/l | - | - | - | - | 0.1 | - | - | - | - | - | |
| µg/l | - | - | - | 0.2 | - | - | - | - | - | - | |
| µg/l | - | 0.5 | - | - | - | - | - | - | 0.2 | - | |
| µg/l | - | - | - | - | - | - | - | 0.1 | - | - | |
| µg/l | - | - | - | - | - | - | - | - | - | - | |
| µg/l | - | 0.9 | 1.4 | 0.6 | 0.7 | 0.7 | 0.6 | - | - | 0.6 | |
| 183881 | 151297 | 36999 | 53544 | 100689 | 98611 | 183690 | 83996 | 105443 | 21686 | ||
| 2014 | 2015 | ||||||||||
| µg/l | 0.2 | 0.2 | |||||||||
| µg/l | - | 0.4 | |||||||||
| µg/l | - | ||||||||||
| µg/l | 0.3 | 0.3 | |||||||||
| µg/l | - | ||||||||||
| µg/l | - | ||||||||||
| µg/l | - | ||||||||||
| µg/l | - | ||||||||||
| µg/l | - | ||||||||||
| µg/l | - | ||||||||||
| µg/l | - | ||||||||||
| µg/l | - | ||||||||||
| µg/l | 0.3 | ||||||||||
| µg/l | - | ||||||||||
| µg/l | 0.5 | 0.5 | |||||||||
| 6512 | 33975 |
Insitute of Public health, 2005-2008; The Health Insurance Institute Maribor, 2009-2014 ; National Laboratory of Health, Environment and Food, 2014-2016
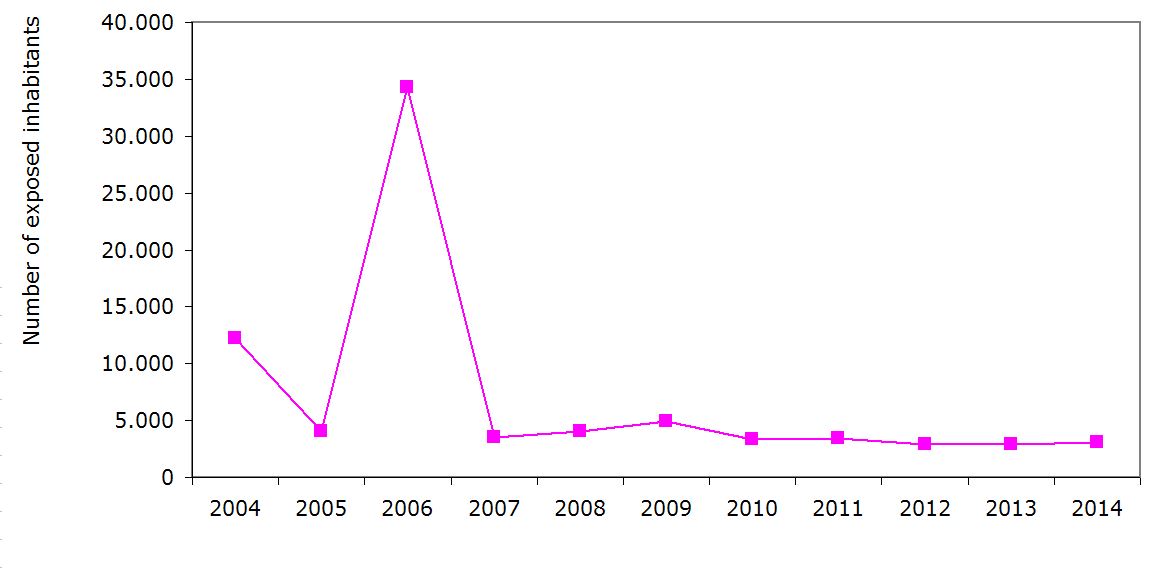
Note to table VD8-5:Number of inhabitants refers to the supply areas in which nitrates have been exceeded in drinking water.
Database on systems for water supply and compliance of drinking water, National Laboratory of Health, Environment and Food 2016; cartographic basis. Slovenian environment agency, The surveying and mapping authority of the RS; Data processing and cartography: National Institute for public health in Slovenian Environment agency, 2016.
Database on systems for water supply and compliance of drinking water, National Laboratory of Health, Environment and Food 2016; cartographic basis. Slovenian environment agency, The surveying and mapping authority of the RS; Data processing and cartography: National Institute for public health in Slovenian Environment agency, 2016.
Database on systems for water supply and compliance of drinking water, National Laboratory of Health, Environment and Food 2016; cartographic basis. Slovenian environment agency, The surveying and mapping authority of the RS; Data processing and cartography: National Institute for public health in Slovenian Environment agency, 2016.


