[PR08] Emissions of air pollutants from transport 

Key message

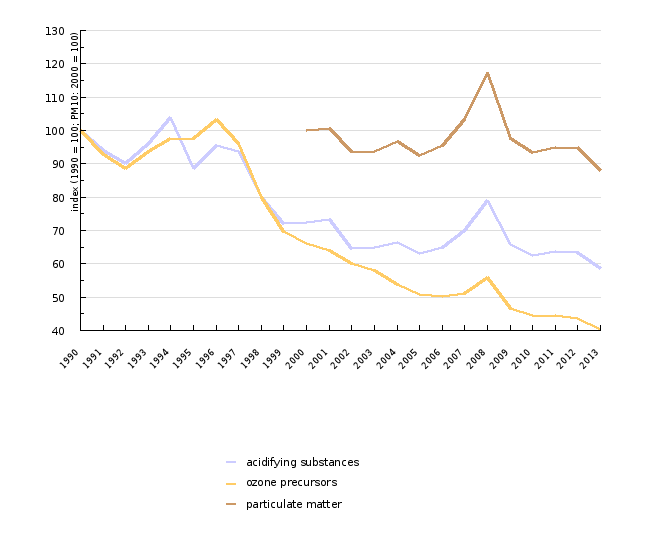
In last decade major emissions of air pollutants from transport decreased. However transport, especially road transport, remains one of the most significant air pollutant. In 2013 road transport contributed 53% to the total emissions of nitrogen oxides. Emissions of substances that cause acidification in the period 1990-2013 reduced by 41%, emissions of ozone precursors by 60%. Emissions of particulate matter in the period 2000-2013 decreased by 12%.
Definition
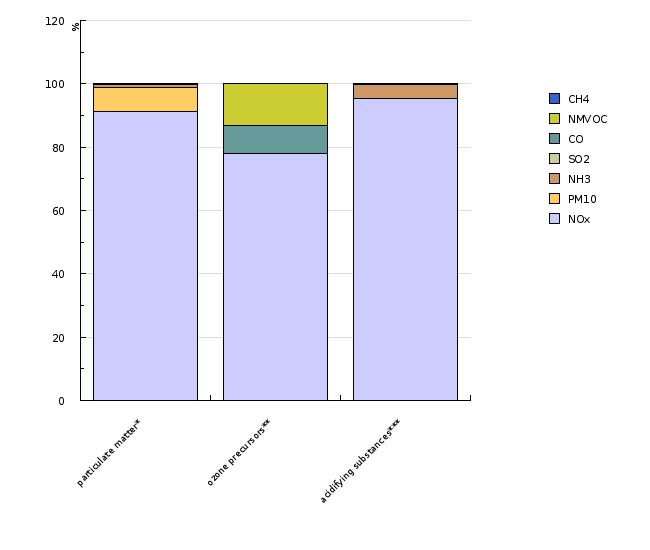
The indicator shows the transport emissions of acidifying substances, ozone precursors and particulates. The structure of emissions is indicated by individual substances.
An ozone precursor is a substance contributing to the formation of ground-level (tropospheric) ozone. The ozone precursors include: nitrogen oxides (NOx), carbon monoxide (CO), methane (CH4) and non-methane volatile organic compounds (NMVOC).
Acidifying substances include: sulphur dioxide (SO2), nitrogen oxides (NOx) and ammonia (NH3).
Particulate emissions can be subdivided into primary particulates PM10 (particulates with a diameter of 10 μm or less, which are directly emitted to air) and secondary particulates PM10 or particulate precursors (part of emissions of NOx, SO2 and NH3, which are as a result of photochemical reactions transformed into particulates with a diameter of 10 μm or less).
Charts
National database on air emissions, Greenhouse gas database, Slovenian Environment Agency, 2015.
| 1990 | 1991 | 1992 | 1993 | 1994 | 1995 | 1996 | 1997 | 1998 | 1999 | ||
|---|---|---|---|---|---|---|---|---|---|---|---|
| acidifying substances | 1000 t acid equivalents | 1 | 1 | 1 | 1 | 1 | 1 | 1 | 1 | 1 | 1 |
| ozone precursors | 1000 t NMVOC equivalents | 103 | 96 | 92 | 97 | 101 | 101 | 107 | 99 | 83 | 72 |
| particulate matter | 1000 t PM10 equivalents | ||||||||||
| acidifying substances | index (1990 = 100) | 100 | 94 | 90 | 96 | 104 | 89 | 95 | 94 | 80 | 72 |
| ozone precursors | index (1990 = 100) | 100 | 93 | 89 | 94 | 98 | 98 | 103 | 96 | 80 | 70 |
| particulate matter | index (2000 = 100) | ||||||||||
| 2000 | 2001 | 2002 | 2003 | 2004 | 2005 | 2006 | 2007 | 2008 | 2009 | ||
| acidifying substances | 1000 t acid equivalents | 1 | 1 | 1 | 1 | 1 | 1 | 1 | 1 | 1 | 1 |
| ozone precursors | 1000 t NMVOC equivalents | 68 | 66 | 62 | 60 | 56 | 52 | 52 | 53 | 58 | 48 |
| particulate matter | 1000 t PM10 equivalents | 29 | 29 | 27 | 27 | 28 | 27 | 28 | 30 | 34 | 28 |
| acidifying substances | index (1990 = 100) | 73 | 73 | 65 | 65 | 66 | 63 | 65 | 70 | 79 | 66 |
| ozone precursors | index (1990 = 100) | 66 | 64 | 60 | 58 | 54 | 51 | 50 | 51 | 56 | 47 |
| particulate matter | index (2000 = 100) | 100 | 101 | 94 | 94 | 97 | 93 | 96 | 103 | 117 | 98 |
| 2010 | 2011 | 2012 | 2013 | ||||||||
| acidifying substances | 1000 t acid equivalents | 1 | 1 | 1 | 1 | ||||||
| ozone precursors | 1000 t NMVOC equivalents | 46 | 46 | 45 | 42 | ||||||
| particulate matter | 1000 t PM10 equivalents | 27 | 28 | 28 | 26 | ||||||
| acidifying substances | index (1990 = 100) | 63 | 64 | 63 | 59 | ||||||
| ozone precursors | index (1990 = 100) | 45 | 44 | 44 | 40 | ||||||
| particulate matter | index (2000 = 100) | 93 | 95 | 95 | 88 |
National database on air emissions, Greenhouse gas database, Slovenian Environment Agency, 2015.
Note to Table ZR08-2: Emissions are expressed as * equivalent emissions of PM10 ** NMVOC equivalent, *** acidification equivalent
| particulate matter* | ozone precursors** | acidifying substances*** | ||
|---|---|---|---|---|
| NOx | 1000 t equiv. (PM10*, NMVOC**, acidif.***) | 23.45 | 32.51 | 0.58 |
| PM10 | 1000 t equiv. (PM10*, NMVOC**, acidif.***) | 1.89 | ||
| NH3 | 1000 t equiv. (PM10*, NMVOC**, acidif.***) | 0.28 | 0.03 | |
| SO2 | 1000 t equiv. (PM10*, NMVOC**, acidif.***) | 0.03 | 0 | |
| CO | 1000 t equiv. (PM10*, NMVOC**, acidif.***) | 3.66 | ||
| NMVOC | 1000 t equiv. (PM10*, NMVOC**, acidif.***) | 5.42 | ||
| CH4 | 1000 t equiv. (PM10*, NMVOC**, acidif.***) | 0 | ||
| Total | 1000 t equiv. (PM10*, NMVOC**, acidif.***) | 25.66 | 41.6 | 0.61 |
| NOx | % | 91.41 | 78.15 | 95.41 |
| PM10 | % | 7.36 | ||
| NH3 | % | 1.1 | 4.29 | |
| SO2 | % | 0.13 | 0.31 | |
| CO | % | 8.81 | ||
| NMVOC | % | 13.03 | ||
| CH4 | % | 0.01 |
National database on air emissions, Greenhouse gas database, Slovenian Environment Agency, 2015.
| 2008 | 2009 | 2010 | 2011 | 2012 | 2013 | ||
|---|---|---|---|---|---|---|---|
| NOx | kt | 11 | 9 | 9 | 10 | 10 | 9 |
| CO2 | kt | 3773 | 3343 | 3287 | 3551 | 3605 | 3413 |
| PM10 | kt | 1 | 1 | 1 | 1 | 1 | 1 |
| PM2.5 | kt | 1 | 1 | 1 | 1 | 1 | 1 |
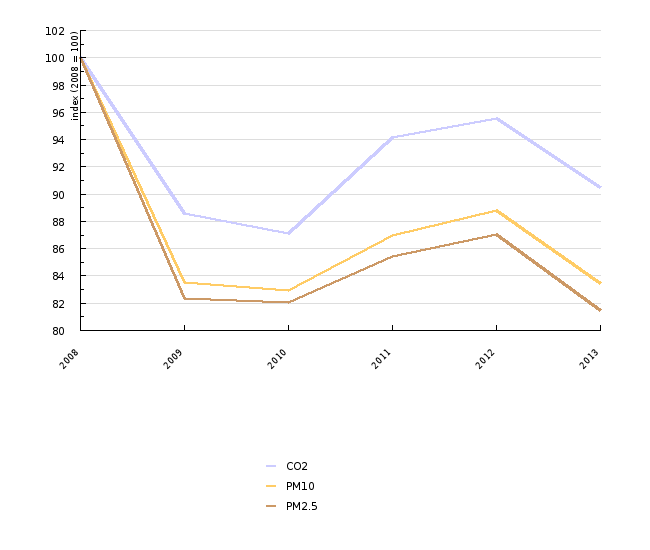
| NOx | index (2008 = 100) | 100 | 84 | 82 | 87 | 89 | 84 |
| CO2 | index (2008 = 100) | 100 | 89 | 87 | 94 | 96 | 90 |
| PM10 | index (2008 = 100) | 100 | 84 | 83 | 87 | 89 | 83 |
| PM2.5 | index (2008 = 100) | 100 | 82 | 82 | 85 | 87 | 81 |


