[PR08] Emissions of air pollutants from transport 

Key message

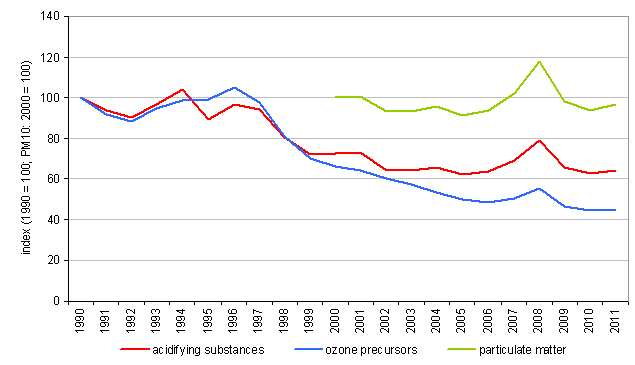
In last decade major emissions of air pollutants from transport decreased. However transport, especially road transport, remains one of the most significant air pollutant. In 2011 road transport contributes 54% to the total emissions of nitrogen oxides.
Definition
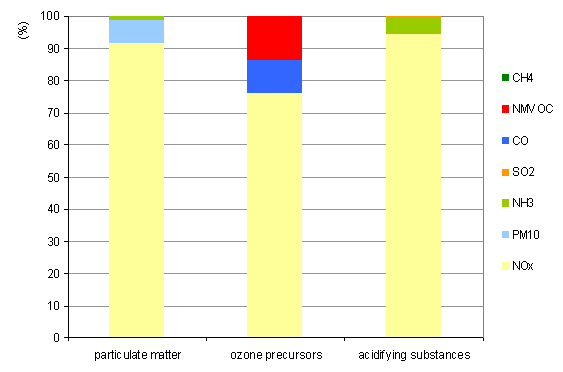
The indicator shows the transport emissions of acidifying substances, ozone precursors and particulates. The structure of emissions is indicated by individual substances.
An ozone precursor is a substance contributing to the formation of ground-level (tropospheric) ozone. The ozone precursors include: nitrogen oxides (NOx), carbon monoxide (CO), methane (CH4) and non-methane volatile organic compounds (NMVOC).
Acidifying substances include: sulphur dioxide (SO2), nitrogen oxides (NOx) and ammonia (NH3).
Particulate emissions can be subdivided into primary particulates PM10 (particulates with a diameter of 10 μm or less, which are directly emitted to air) and secondary particulates PM10 or particulate precursors (part of emissions of NOx, SO2 and NH3, which are as a result of photochemical reactions transformed into particulates with a diameter of 10 μm or less).
Charts
Environmental Agency of the Republic of Slovenia; Jožef Stefan Institute.
| 1990 | 1991 | 1992 | 1993 | 1994 | 1995 | 1996 | 1997 | 1998 | 1999 | ||
|---|---|---|---|---|---|---|---|---|---|---|---|
| acidifying substances | 1000 t acid equivalents | 1 | 1 | 1 | 1 | 1 | 1 | 1 | 1 | 1 | 1 |
| ozone precursors | 1000 t NMVOC equivalents | 100 | 91 | 88 | 95 | 98 | 99 | 105 | 97 | 81 | 70 |
| particulate matter | 1000 t PM10 equivalents | ||||||||||
| acidifying substances | index (1990 = 100) | 100 | 94 | 90 | 97 | 104 | 89 | 96 | 94 | 80 | 72 |
| ozone precursors | index (1990 = 100) | 100 | 92 | 88 | 95 | 99 | 99 | 105 | 98 | 81 | 70 |
| particulate matter | index (2000 = 100) | ||||||||||
| 2000 | 2001 | 2002 | 2003 | 2004 | 2005 | 2006 | 2007 | 2008 | 2009 | ||
| acidifying substances | 1000 t acid equivalents | 1 | 1 | 1 | 1 | 1 | 1 | 1 | 1 | 1 | 1 |
| ozone precursors | 1000 t NMVOC equivalents | 66 | 64 | 60 | 58 | 53 | 50 | 49 | 50 | 55 | 47 |
| particulate matter | 1000 t PM10 equivalents | 28 | 28 | 26 | 26 | 27 | 25 | 26 | 28 | 33 | 27 |
| acidifying substances | index (1990 = 100) | 73 | 73 | 64 | 64 | 66 | 62 | 64 | 69 | 79 | 66 |
| ozone precursors | index (1990 = 100) | 66 | 64 | 60 | 58 | 53 | 50 | 49 | 50 | 56 | 47 |
| particulate matter | index (2000 = 100) | 100 | 101 | 93 | 93 | 96 | 91 | 94 | 102 | 118 | 98 |
| 2010 | 2011 | ||||||||||
| acidifying substances | 1000 t acid equivalents | 1 | 1 | ||||||||
| ozone precursors | 1000 t NMVOC equivalents | 44 | 45 | ||||||||
| particulate matter | 1000 t PM10 equivalents | 26 | 27 | ||||||||
| acidifying substances | index (1990 = 100) | 63 | 64 | ||||||||
| ozone precursors | index (1990 = 100) | 45 | 45 | ||||||||
| particulate matter | index (2000 = 100) | 94 | 96 |
Environmental Agency of the Republic of Slovenia; Jožef Stefan Institute.
| particulate matter | ozone precursors | acidifying substances | ||
|---|---|---|---|---|
| NOx | 1000 t equiv. (PM10*, NMVOC**, acidif.***) | 24.5 | 33.96 | 0.61 |
| PM10 | 1000 t equiv. (PM10*, NMVOC**, acidif.***) | 1.89 | ||
| NH3 | 1000 t equiv. (PM10*, NMVOC**, acidif.***) | 0.36 | 0.03 | |
| SO2 | 1000 t equiv. (PM10*, NMVOC**, acidif.***) | 0.03 | 0 | |
| CO | 1000 t equiv. (PM10*, NMVOC**, acidif.***) | 4.52 | ||
| NMVOC | 1000 t equiv. (PM10*, NMVOC**, acidif.***) | 6.13 | ||
| CH4 | 1000 t equiv. (PM10*, NMVOC**, acidif.***) | 0.01 | ||
| Total | 1000 t equiv. (PM10*, NMVOC**, acidif.***) | 26.78 | 44.62 | 0.64 |
| NOx | % | 91.48 | 76.12 | 94.54 |
| PM10 | % | 7.05 | ||
| NH3 | % | 1.34 | 5.16 | |
| SO2 | % | 0.12 | 0.29 | |
| CO | % | 10.13 | ||
| NMVOC | % | 13.74 | ||
| CH4 | % | 0.01 |
Goals
Reduction of national emissions of nitrogen oxides to 45 thousand tonnes, sulphur dioxide to 27 thousand tonnes, non-methane volatile hydrocarbons to 40 thousand tonnes and ammonia to 20 thousand tonnes by 2010.


