[VD02] Waste water treatment

Key message

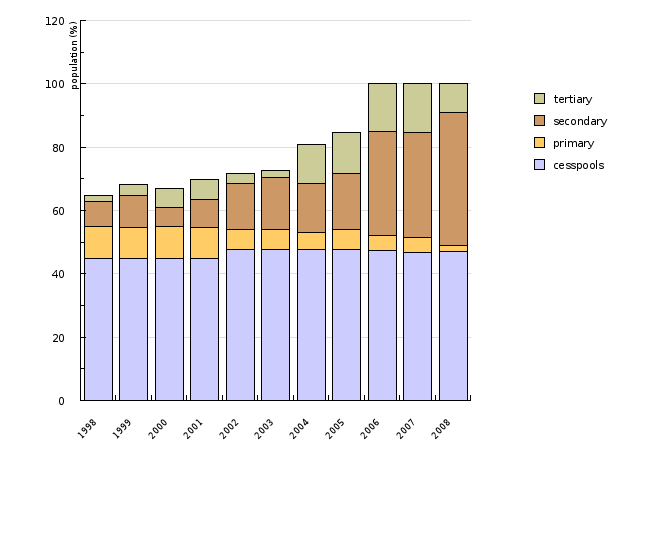
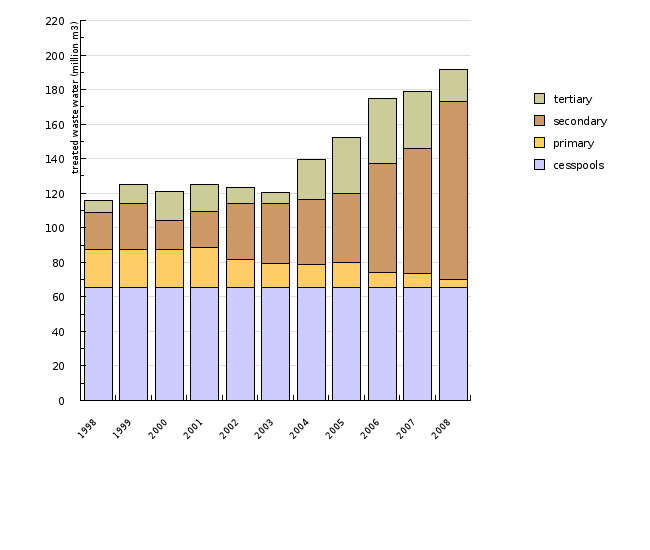
The share of Slovenian population whose urban waste water was treated in urban or common waste water treatment plants has risen from one fifth in 1998 to more than half (53%) in 2008, and mayority (97%) of 126 million m3 of treated waste water in all reached at least secondary level of treatment.
Definition
This indicator shows the quantity of urban waste water and the share of population whose urban waste water is treated in waste water treatment plants classified according to the level of treatment under the methodology determined in the EC Council Directive 91/271/EEC Concerning Urban Waste Water Treatment. This methodology is also adopted in the Slovenian Decree on the Emission of Substances in Waste Water Discharged from Urban Waste Water Treatment Plants (OJ RS No 35/96, 90/98, 31/01, 62/01, 41/2004-ZVO-1). The methodology determines that primary treatment is treatment of urban waste water by physical and/or chemical process involving settlement of suspended solids or other processes in which the BOD5 of the incoming waste water is reduced by at least 20% before discharge and the total suspended solids of the incoming waste water are reduced by at least 50%. Secondary treatment means treatment of urban waste water by a process generally involving biological treatment with a secondary settlement or other process in a major portion of the organic loading and part (20%-30%) of the nutrient loading are removed. Tertiary treatment is treatment in which, in addition to the organic loading, a major portion of the nutrient loading is also removed.
Charts
Waste Water Treatment Plants Database, Environmental Agency of the Republic of Slovenia, 2009; expert assessment
| 1998 | 1999 | 2000 | 2001 | 2002 | 2003 | 2004 | 2005 | 2006 | 2007 | ||
|---|---|---|---|---|---|---|---|---|---|---|---|
| cesspools | % | 45 | 45 | 45 | 45 | 47.6 | 47.6 | 47.6 | 47.6 | 47.4 | 46.8 |
| primary | % | 9.9 | 9.5 | 10.1 | 9.6 | 6.4 | 6.4 | 5.6 | 6.3 | 4.7 | 4.8 |
| secondary | % | 7.8 | 10.3 | 5.9 | 8.8 | 14.5 | 16.5 | 15.4 | 17.9 | 32.8 | 33.1 |
| tertiary | % | 2 | 3.4 | 6.1 | 6.3 | 3.3 | 2.1 | 12.4 | 12.8 | 15.1 | 15.3 |
| 2008 | |||||||||||
| cesspools | % | 46.9 | |||||||||
| primary | % | 1.9 | |||||||||
| secondary | % | 42 | |||||||||
| tertiary | % | 9.2 |
Waste Water Treatment Plants Database, Environmental Agency of the Republic of Slovenia, 2009; expert assessment
| 1998 | 1999 | 2000 | 2001 | 2002 | 2003 | 2004 | 2005 | 2006 | 2007 | ||
|---|---|---|---|---|---|---|---|---|---|---|---|
| cesspools | million m3 | 65.7 | 65.7 | 65.7 | 65.7 | 65.7 | 65.7 | 65.7 | 65.7 | 65.7 | 65.7 |
| primary | million m3 | 21.7 | 21.6 | 21.9 | 22.9 | 16 | 13.9 | 12.9 | 14.1 | 8.3 | 8 |
| secondary | million m3 | 21.7 | 26.9 | 16.5 | 20.7 | 32.2 | 34.5 | 37.7 | 39.9 | 63.2 | 72 |
| tertiary | million m3 | 6.9 | 10.9 | 17 | 16 | 9.2 | 6.6 | 23.5 | 32.4 | 37.7 | 33.2 |
| 2008 | |||||||||||
| cesspools | million m3 | 65.7 | |||||||||
| primary | million m3 | 4.1 | |||||||||
| secondary | million m3 | 103.3 | |||||||||
| tertiary | million m3 | 18.8 |
Goals
The National Environmental Action Programme which assumes the objectives of the EC Council Directive 91/271/EEC Concerning Urban Waste Water Treatment provides for a gradual upgrading and construction of new waste water treatment facilities for all agglomerations with more than 2000 inhabitants.
The targets which the EU seeks to attain in the area of urban waste water treatment are set out in the Council Directive on urban waste water treatment. In their pre-accession negotiations with the EU in this area Slovenian negotiators were able to secure an agreement guaranteeing that Slovenia would meet these targets with a certain deferment. This is primarily a consequence of the fact that in order to reach the targets set out by the Council Directive on urban waste water treatment Slovenia would need major financial input and time to build the infrastructure.
In Slovenia, the targets for this area are noted in the Decree on the Emission of Substances in Waste Water Discharged from Urban Waste Water Treatment Plants (OJ RS No 35/96, 90/98, 31/01, 62/01), which sets out precisely by which year we will construct the necessary treatment facilities in specific agglomerations. These targets are operationalized in the Ordinance on the Operational Programme for Urban Waste Water Drainage and Treatment with the Programme of Water Supply Projects (OJ RS No 94-4485/1999). This document also contains a precise definition as to which treatment facilities will be constructed/upgraded, under what timetables and how much financial input will be needed.
Comment
The Operational Programme is being implemented according to the envisaged plan. In illustration of its effects, figures VD2-1 and VD2-2 represent the envisaged situation in the area of waste water treatment in 2005, when the programme will already be partly carried out. By that time, we envisage the construction of the majority of larger treatment facilities, so that the share of treated waste water will increase significantly in comparison with the current situation. After 2006, only smaller treatment facilities will be constructed and no major increase in the share of treated waste water can be expected thereafter.
Methodology
The data on the quantities of treated water (with the exception of the data on cesspool treatment) and the population data are taken from reports on operational monitoring of urban and common waste water treatment plants. The obligation to perform monitoring of treatment facilities and issue reports on monitoring is defined in Article 24 of the Decree on the Emission of Substances and Heat in the Discharge of Waste Water from Pollution Sources (OJ RS No 35/96, 21/2003, 2/2004, 41/2004-ZVO-1, 47/2005). The actual form of treatment facility monitoring is defined in the Rules on Initial Measurements and Operational Monitoring of Waste Water and on Conditions for their Implementation (OJ RS No 35/96, 29/00, 106/01). The data are collected in written and electronic forms. They are processed in the Waste Water Treatment Plants Database at Environmental Agency of the Republic of Slovenia.
Eventual changes of data in previous year’s series are due to the newly registered plants and the corrections of errors, discovered in deeper analysis of the data entered.
According to the 1996 Report on the State of the Environment in Slovenia, 45 % of the population were served by cesspools. The datum showing that in 2002 47.6 % of the population were served by cesspools is taken from the data of the Statistical Office of the Republic of Slovenia. We estimated the quantity of waste water produced in water treatment via cesspools at 0.2 m3/day per population unit, i.e. for 900,000 people 65,700 *1000 m3/year and for 923,300 people 67,400 *1000 m3/year, respectively.


