[VD02] Wastewater treatment

Key message

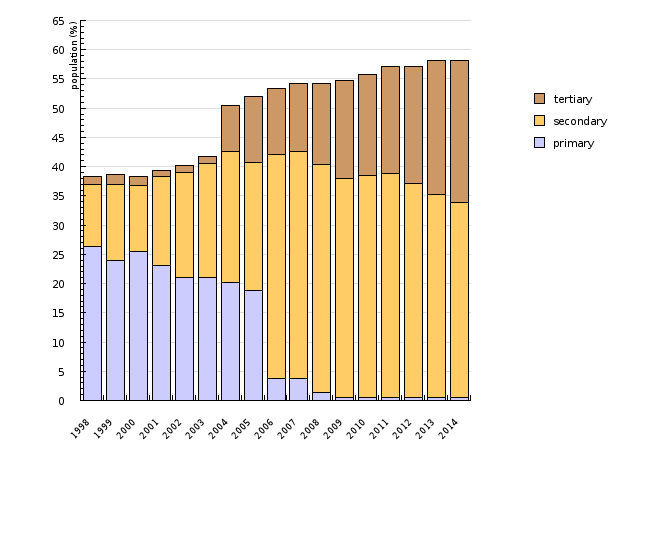
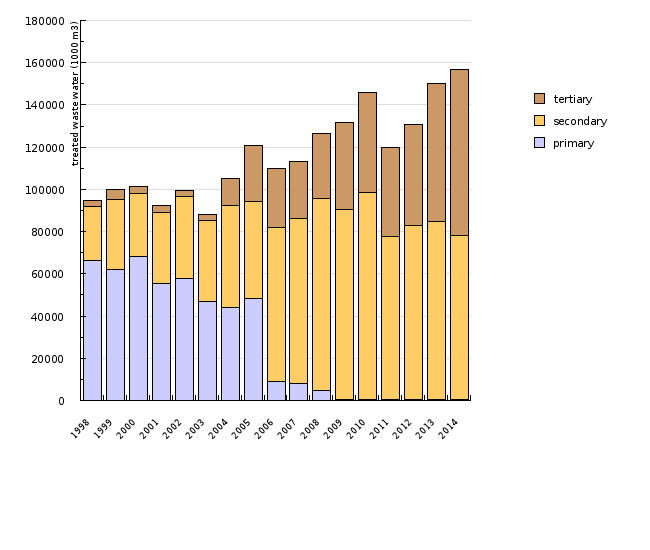
In recent years, the amount of wastewater treated by secondary or tertiary treatment processes increased, while the amount of wastewater treated exclusively through primary treatment processes decreased. The amount of wastewater treated with secondary treatment processes has increased by 205% since 2002, from 38 million m3 (in 2002) to almost 78 million m3 (in 2014). Tertiary wastewater treatment was almost non-existent in Slovenia in 2003, while in 2014, 50% of all treated wastewater, or 78 million m3, was treated by tertiary processes.
Definition
This indicator shows the quantity of industrial and municipal/urban wastewater and the share of population whose wastewater is treated in municipal/urban and combined wastewater treatment plants classified according to the level of treatment under the methodology determined in the Urban Waste Water Treatment Directive. This methodology was also adopted in the Slovenian Decree on the Emission of Substances in Waste Water Discharged from Urban Waste Water Treatment Plants (OJ RS No 35/96, 90/98, 31/01, 62/01, 41/2004-ZVO-1). In general terms, primary treatment is mechanical and/or chemical. It includes removal of settleable organic and inorganic solids by sedimentation and removal of materials that float (scum) by skimming. Secondary treatment is biological. It removes most organic matter and 20–30% of nutrients. Tertiary treatment removes (apart from organic matter) most nutrients (nitrogen, phosphorus).
Charts
Waste Water Treatment Plants Database, Environmental Agency of the Republic of Slovenia, 2016; Statistical Office of the Republic of Slovenia, 2016
| 1998 | 1999 | 2000 | 2001 | 2002 | 2003 | 2004 | 2005 | 2006 | 2007 | ||
|---|---|---|---|---|---|---|---|---|---|---|---|
| primary | % | 26.4 | 23.9 | 25.5 | 23.1 | 21 | 21.1 | 20.2 | 18.9 | 3.8 | 3.7 |
| secondary | % | 10.6 | 13 | 11.2 | 15.2 | 18 | 19.4 | 22.4 | 21.8 | 38.2 | 38.8 |
| tertiary | % | 1.3 | 1.7 | 1.6 | 1.1 | 1.1 | 1.2 | 7.9 | 11.4 | 11.4 | 11.7 |
| primary | number | 523544 | 475758 | 508300 | 459772 | 419025 | 420408 | 403676 | 378233 | 76142 | 75402 |
| secondary | number | 209331 | 258143 | 223142 | 302394 | 359432 | 388173 | 447155 | 435607 | 767470.8 | 784073 |
| tertiary | number | 25738 | 33801 | 32592 | 22725 | 22344 | 24174 | 158096 | 227426 | 228866 | 236878 |
| population - total | number | 1982603 | 1988887 | 1990272 | 1992035 | 1995718 | 1996773 | 1997004 | 2001114 | 2008516 | 2019406 |
| 2008 | 2009 | 2010 | 2011 | 2012 | 2013 | 2014 | |||||
| primary | % | 1.3 | 0.5 | 0.5 | 0.5 | 0.5 | 0.5 | 0.5 | |||
| secondary | % | 39.1 | 37.5 | 38 | 38.3 | 36.6 | 34.7 | 33.4 | |||
| tertiary | % | 13.9 | 16.7 | 17.4 | 18.3 | 20.1 | 22.9 | 24.3 | |||
| primary | number | 26646 | 9330 | 9559 | 9416 | 9433 | 9416 | 9330 | |||
| secondary | number | 789953.6 | 765519.6 | 778728.8 | 786549.8 | 753101 | 714807.6 | 688557.4 | |||
| tertiary | number | 280353 | 341719 | 356169 | 376165 | 413738 | 471797 | 501101 | |||
| population - total | number | 2022629 | 2042335 | 2049261 | 2052496 | 2056262 | 2059114 | 2061623 |
Waste Water Treatment Plants Database, Slovenian Environment Agency, 2016
| 1998 | 1999 | 2000 | 2001 | 2002 | 2003 | 2004 | 2005 | 2006 | 2007 | ||
|---|---|---|---|---|---|---|---|---|---|---|---|
| primary | 1000 m3 | 66151 | 62146 | 68077 | 55558 | 57904 | 46981 | 43997 | 48536 | 8779 | 8035 |
| secondary | 1000 m3 | 25731 | 33223 | 30132 | 33590 | 38675 | 38485 | 48409 | 45642 | 72965 | 77945 |
| tertiary | 1000 m3 | 2886 | 4619 | 3371 | 3093 | 2748 | 2633 | 12744 | 26656 | 27933 | 27209 |
| 2008 | 2009 | 2010 | 2011 | 2012 | 2013 | 2014 | |||||
| primary | 1000 m3 | 4560 | 467 | 458 | 450 | 433 | 446 | 435 | |||
| secondary | 1000 m3 | 90991 | 90124 | 98010 | 77443 | 82295 | 84356 | 77956 | |||
| tertiary | 1000 m3 | 30694 | 41063 | 47193 | 42064 | 48226 | 65568 | 78188 |
Goals
- To ensure protection of all surface and groundwater bodies on the territory of the Republic of Slovenia from organic pollution, nitrogen and phosphorus input and microbiological pollution.
- To construct municipal wastewater treatment plants and sewer networks for all agglomerations specified in the Operational programme for the discharge and treatment of urban wastewater for the period 2005-2017 and to provide collection, discharge and treatment of urban wastewater by the end of 2015 and discharge and treatment of wastewater in small treatment plants for individual buildings by the end of 2017. With the adoption of the Decree on the discharge and treatment of urban wastewater at the end of 2015, transitional periods for the construction of small urban wastewater treatment plants in sensitive areas were extended to the end of 2021 and in other areas to the end of 2023.
Comment
The level of development of wastewater treatment systems varies greatly between the EU Member States. Approximately 70% of the EU population is connected to treatment plants. This rate is greatest in the Netherlands where 99% of the population is connected to treatment plants. In Spain, Germany, Italy and Austria, the rate is around 90%. According to 2014 data, the connection rate in Slovenia is 58%, which means that Slovenia is ranked among EU countries with a low percentage of population connected to urban and combined wastewater treatment plants and that almost half of the population still uses septic tanks. Of these, less than 1 per cent is represented by small treatment plants with a capacity of less than 50 PE.
The Operational programme for the discharge and treatment of urban wastewater (in this field it transposes the requirements of the Council Directive 91/271/EEC of 21 May 1991 concerning urban wastewater treatment [91/271/EEC] and transitional periods for the implementation of the Directive agreed upon during the accession negotiations) in relation to the Decree on the discharge and treatment of urban wastewater (Official Gazette of the Republic of Slovenia, Nos. 64/12, 64/14 in 98/15) specifies the following goal:
I. To build municipal wastewater treatment plants with a treatment capacity equal to or exceeding 2,000 PE (and small municipal wastewater treatment plants with a treatment capacity below 2,000 PE), in which urban wastewater from agglomerations with a total load equal to or greater than 2,000 PE will be treated and which will, by 31 December 2015, effectively provide:
- secondary treatment,
- tertiary treatment in areas that are sensitive due to eutrophication and/or in catchment areas of bathing waters,
- tertiary treatment in settled areas with a load greater than or equal to 10,000 PE, in the Danube catchment area outside catchments of sensitive areas (the deadline for existing facilities is 22 August 2016),
- tertiary treatment where wastewater is discharged into a flowing surface water body in which mean low discharge is lower than ten times the highest mean six-hour discharge of wastewater from the urban wastewater treatment plant (the deadline for existing facilities is 22 August 2016),
- in addition to tertiary treatment, additional microbiological treatment in the hinterland of sensitive areas (bathing waters),
- additional microbiological treatment for indirect discharge into subterranean waters in karst areas,
For existing small municipal wastewater treatment plants with a treatment capacity greater than or equal to 50 PE and lower than 2,000 PE (in which urban wastewater from agglomerations with a total load greater than or equal to 2,000 PE will be treated), the deadline of 31 December 2020 applies rather than the above stated deadlines.
II. To build small municipal wastewater treatment plants with treatment capacities greater than or equal to 50 PE and lower than 2,000 PE, in which urban wastewater from agglomerations with a total load greater than or equal to 2,000 PE will be treated and which will provide:
- adequate treatment in sensitive catchment areas, in catchment areas of bathing waters or in water protection areas for agglomerations with a total load greater than or equal to 500 PE and lower than 2,000 PE, no later than by 31 December 2021,
- adequate treatment in sensitive catchment areas, in catchment areas of bathing waters or in water protection areas for agglomerations with a total load below 500 PE
- adequate treatment in all other areas, no later than by 31 December 2023,
- adequate treatment with additional microbiological treatment during the bathing season in catchment areas of bathing waters (for urban wastewater from agglomeration with a total load greater than or equal to 500 PE or for municipal wastewater treatment plants with a capacity greater than or equal to 500 PE) in cases of indirect discharge into groundwater or direct discharge into surface waters, no later than by 31 December 2021.
III. To build small municipal wastewater treatment plants with a treatment capacity lower than 50 PE in areas outside agglomerations:
- to provide adequate treatment in sensitive catchment areas, in catchment areas of bathing waters or in water protection areas, no later than by 31 December 2015,
- to provide adequate treatment outside sensitive areas referred to in the preceding paragraph, no later than by 31 December 2017.
In cases of existing buildings in which no treatment is provided or treatment is not compliant with regulations that were in force during the construction of such buildings, the deadline is 31 December 2021. In cases where treatment is in accordance with regulations in force during the construction of such buildings, adequate treatment must be provided no later than during the earliest renovation of the building. In agglomerations with a total load below 500 PE, subject to economic assessment of equipping such an agglomeration with a public sewer network and an urban wastewater treatment plant or with small wastewater treatment plants, the deadline is 31 December 2023.
In exceptional cases in which urban wastewater treatment in a small treatment plant is not feasible due to prohibited discharge of wastewater into waters or special circumstances that can negatively affect the operation of a small treatment plant (e.g. altitude above 1,500 m, etc.), urban wastewater will be collected in no-flow-through septic tanks.


