-
-
-
-
-
-
-
-
Tools and collections
- Environmental atlas
- EIONET in Slovenia
- Environmental indicators
- IED devices
- Endangered species
- IS-waste

-
-
Tools and collections
- Environmental atlas
- EIONET in Slovenia
- Environmental indicators
- IED devices
- Endangered species
- IS-waste

[VD02] Waste water treatment

Key message

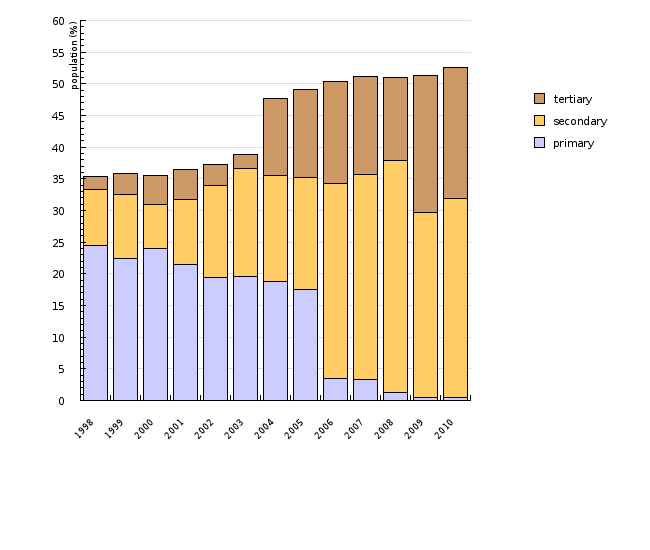
In recent years, the amount of waste water treated by processes of secondary or tertiary treatment increased, while the amount with primary treatment decreased. The amount of wastewater that was treated with secondary treatment processes, has, since 2003, increased by 244% or 36 million m 3 (in 2003) to 88 million m 3 (in 2010). Tertiary wastewater treatment was almost nonexistent in Slovenia in 2003, while in 2010 39% of all treated wastewater, or 57 million m 3 wastewater was treated by tertiary processes.
Definition
Charts
Waste Water Treatment Plants Database, Environmental Agency of the Republic of Slovenia, 2012; Statistical Office of the Republic of Slovenia, 2012
| 1998 | 1999 | 2000 | 2001 | 2002 | 2003 | 2004 | 2005 | 2006 | 2007 | ||
|---|---|---|---|---|---|---|---|---|---|---|---|
| primary | % | 24.4 | 22.4 | 24 | 21.5 | 19.5 | 19.6 | 18.9 | 17.6 | 3.4 | 3.4 |
| secondary | % | 9 | 10 | 7 | 10.2 | 14.4 | 17.1 | 16.7 | 17.7 | 30.9 | 32.2 |
| tertiary | % | 2 | 3.4 | 4.6 | 4.8 | 3.4 | 2.3 | 12.1 | 13.8 | 16 | 15.5 |
| primary | number | 484238 | 445586 | 477467 | 427604 | 388870 | 391092 | 376599 | 351844 | 68881 | 68331 |
| secondary | number | 177603 | 198897 | 138716 | 203091 | 287225 | 340815 | 333805 | 353504 | 620615 | 651074 |
| tertiary | number | 40014 | 66948 | 92199 | 96323 | 68835 | 45014 | 241400 | 275888 | 321086 | 313942 |
| population - total | number | 1982603 | 1985557 | 1990272 | 1992035 | 1995718 | 1996773 | 1997004 | 2001114 | 2008516 | 2019406 |
| 2008 | 2009 | 2010 | |||||||||
| primary | % | 1.3 | 0.4 | 0.5 | |||||||
| secondary | % | 36.6 | 29.3 | 31.5 | |||||||
| tertiary | % | 13.1 | 21.6 | 20.6 | |||||||
| primary | number | 26397 | 9081 | 9812 | |||||||
| secondary | number | 741213 | 597940 | 644519 | |||||||
| tertiary | number | 264988 | 441208 | 422285 | |||||||
| population - total | number | 2022629 | 2042335 | 2049261 |
Waste Water Treatment Plants Database, Environmental Agency of the Republic of Slovenia, 2012
| 1998 | 1999 | 2000 | 2001 | 2002 | 2003 | 2004 | 2005 | 2006 | 2007 | ||
|---|---|---|---|---|---|---|---|---|---|---|---|
| primary | 1000 m3 | 66151 | 62146 | 68077 | 55558 | 57904 | 46981 | 43997 | 48536 | 8779 | 8035 |
| secondary | 1000 m3 | 23570 | 29038 | 19007 | 22800 | 34093 | 36391 | 37690 | 41007 | 64304 | 72351 |
| tertiary | 1000 m3 | 5047 | 8804 | 14496 | 13883 | 7330 | 4727 | 23464 | 31291 | 36594 | 32804 |
| 2008 | 2009 | 2010 | |||||||||
| primary | 1000 m3 | 4560 | 467 | 496 | |||||||
| secondary | 1000 m3 | 91348 | 76804 | 88640 | |||||||
| tertiary | 1000 m3 | 30336 | 54383 | 56766 |
Comment
Mateja Jelovčan, Slovenian Environment Agency


