[EN11] Total energy intensity
[EN11] Total energy intensity

Key message

Slovenia has a high degree of energy intensity, but her reduction has stopped in recent years. Due to Slovenia departs from the average EU-27. This represents a departure from the goals set.
Definition
Charts
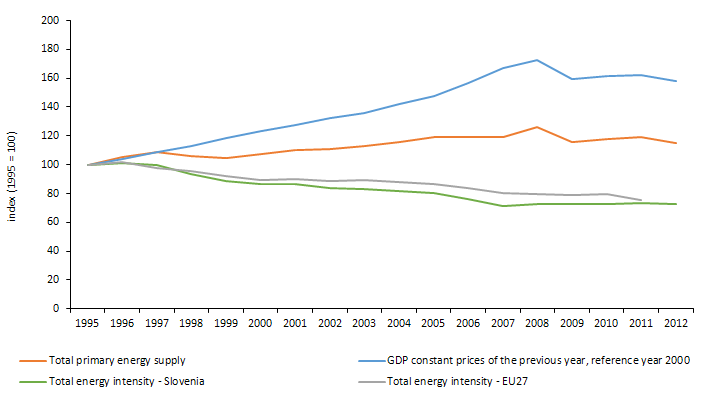
Figure EN11-1: Trends in total energy consumption, gross domestic product and total energy intensity in period 1995-2012 according to 1995 and comparison with the intensity trend in EU-27
Sources:
The jožef Stefan Institute, Statistical Office of the RS, EUROSTAT, 2013
| 1995 | 1996 | 1997 | 1998 | 1999 | 2000 | 2001 | 2002 | 2003 | 2004 | ||
|---|---|---|---|---|---|---|---|---|---|---|---|
| Total primary energy supply | ktoe | 6060 | 6362 | 6572 | 6405 | 6347 | 6491 | 6665 | 6730 | 6823 | 7030 |
| GDP constant prices of the previous year, reference year 2005 | mio EUR | 19443 | 20152 | 21151 | 21895 | 23061 | 24044 | 24751 | 25698 | 26451 | 27616 |
| Total energy intensity - Slovenia | toe/mio EUR 2005 | 312 | 316 | 311 | 293 | 275 | 270 | 269 | 262 | 258 | 255 |
| Total energy intensity - EU27 | toe/mio EUR 2005 | 191 | 194 | 186 | 182 | 176 | 171 | 171 | 169 | 170 | 168 |
| Total primary energy supply | Index (1995 = 100) | 100 | 105 | 108 | 106 | 105 | 107 | 110 | 111 | 113 | 116 |
| GDP constant prices of the previous year, reference year 2000 | Index (1995 = 100) | 100 | 104 | 109 | 113 | 119 | 124 | 127 | 132 | 136 | 142 |
| Total energy intensity - Slovenia | Index (1995 = 100) | 100 | 101 | 100 | 94 | 88 | 87 | 86 | 84 | 83 | 82 |
| Total energy intensity - EU27 | Index (1995 = 100) | 100 | 102 | 98 | 96 | 92 | 90 | 90 | 88 | 89 | 88 |
| 2005 | 2006 | 2007 | 2008 | 2009 | 2010 | 2011 | 2012 | ||||
| Total primary energy supply | ktoe | 7207 | 7225 | 7233 | 7650 | 7016 | 7122 | 7236 | 6988 | ||
| GDP constant prices of the previous year, reference year 2005 | mio EUR | 28722 | 30402 | 32518 | 33619 | 30948 | 31338 | 31560 | 30757 | ||
| Total energy intensity - Slovenia | toe/mio EUR 2005 | 251 | 238 | 222 | 228 | 227 | 227 | 229 | 227 | ||
| Total energy intensity - EU27 | toe/mio EUR 2005 | 165 | 159 | 153 | 152 | 150 | 152 | 144 | |||
| Total primary energy supply | Index (1995 = 100) | 119 | 119 | 119 | 126 | 116 | 118 | 119 | 115 | ||
| GDP constant prices of the previous year, reference year 2000 | Index (1995 = 100) | 148 | 156 | 167 | 173 | 159 | 161 | 162 | 158 | ||
| Total energy intensity - Slovenia | Index (1995 = 100) | 80 | 76 | 71 | 73 | 73 | 73 | 74 | 73 | ||
| Total energy intensity - EU27 | Index (1995 = 100) | 86 | 84 | 80 | 80 | 79 | 80 | 76 |
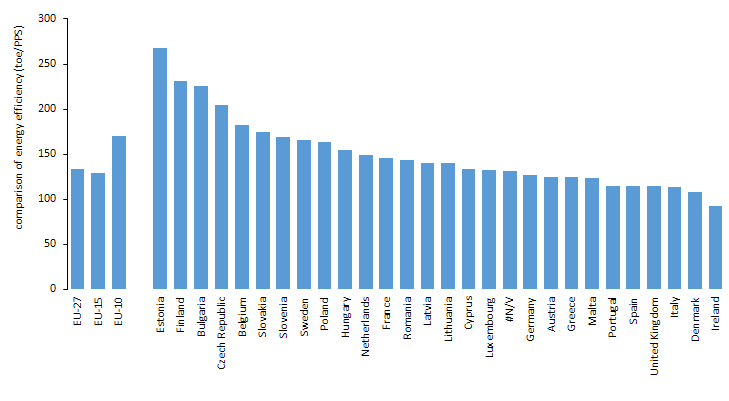
Figure EN11-2: Comparison of the energy intensity (TPES/GDP in PPS) between EU-27 countries for 2011
Sources:
Eurostat, The Jožef Stefan Institute, 2013
| EU-27 | EU-15 | EU-10 | ||
|---|---|---|---|---|
| Total energy intensity 2011 | toe/PPS | 134 | 129 | 170 |
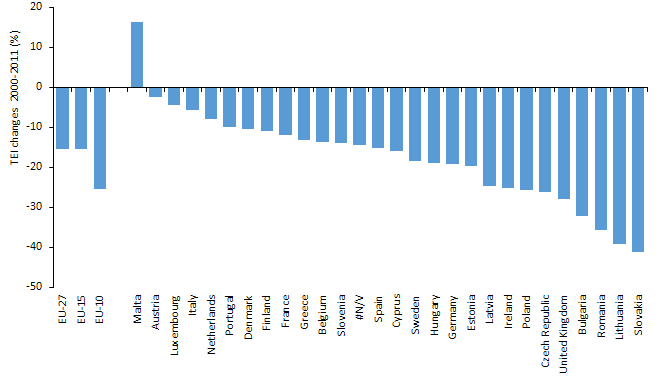
Figure EN11-3: Comparison of total energy intensity in the period 2000-2011
Sources:
EUROSTAT, The Jožef Stefan Institute, 2013
| EU-27 | EU-15 | EU-10 | ||
|---|---|---|---|---|
| TEI change 2000-2010 (%) | % | -16 | -15 | -26 |
| TEI 2000 | toe/mio EUR 2005 | 171 | 154 | 426 |
| TEI 2011 | toe/mio EUR 2005 | 144 | 130 | 317 |


