[EN11] Total energy intensity

Key message

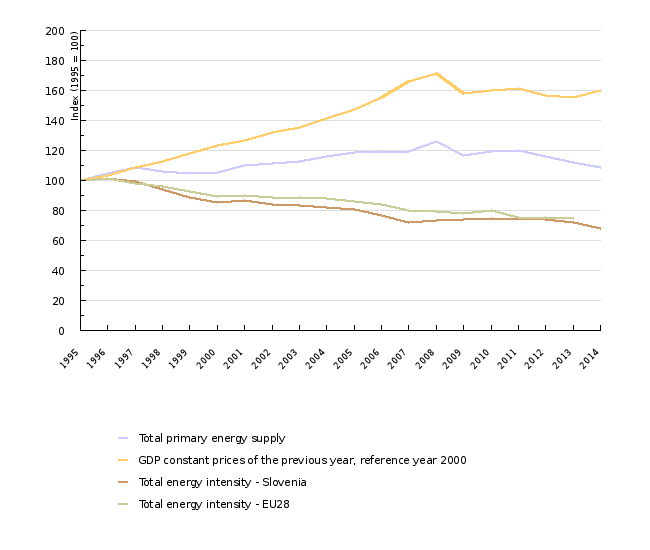
The level of energy intensity in Slovenia is high and stopped declining in the period 2008–2011. A decline has been observed again over the past three years, with a particularly encouraging reduction in 2014. The long term trend of approaching the average of the EU-28 shows that it is happening too slowly.
Definition
This indicator presents total energy intensity (TEI), expressed as the ratio between total energy consumption and gross domestic product for a particular calendar year. Energy consumption per unit of BDP is one of the key indicators of sustainable development. It shows the effectiveness of decoupling between energy consumption and economic growth over time. The indicator decreases when GDP grows at a higher rate than energy consumption and when environmental pressures are directly proportional to energy consumption.
Energy intensity decreases along with the improvement of energy efficiency (Statistical Office of the Republic of Slovenia, 2009). It enables us to assess energy consumption and energy efficiency of a country's economy. Energy intensity is expressed in toe/million Euros 2005 (energy consumption is measured in tonnes of oil equivalent, while gross domestic product is converted to 2005 Constant Prices, in Euros, in order to enable direct comparability among EU countries).
Total energy consumption is the entire consumption of energy in various forms: solid, liquid and gaseous fuels, nuclear energy, renewable energy sources and export/import of electricity (net electricity import).
Charts
The jožef Stefan Institute, Statistical Office of the RS, EUROSTAT, 2015
| 1995 | 1996 | 1997 | 1998 | 1999 | 2000 | 2001 | 2002 | 2003 | 2004 | ||
|---|---|---|---|---|---|---|---|---|---|---|---|
| Total primary energy supply | ktoe | 6060 | 6362 | 6572 | 6405 | 6347 | 6394 | 6665 | 6730 | 6823 | 7030 |
| GDP constant prices of the previous year, reference year 2005 | mio EUR | 19878 | 20577 | 21629 | 22340 | 23518 | 24496 | 25218 | 26186 | 26930 | 28102 |
| Total energy intensity - Slovenia | toe/mio EUR 2005 | 305 | 309 | 304 | 287 | 270 | 261 | 264 | 257 | 253 | 250 |
| Total energy intensity - EU28 | toe/mio EUR 2005 | 190 | 193 | 187 | 182 | 176 | 170 | 171 | 168 | 169 | 167 |
| Total primary energy supply | Index (1995 = 100) | 100 | 105 | 108 | 106 | 105 | 106 | 110 | 111 | 113 | 116 |
| GDP constant prices of the previous year, reference year 2000 | Index (1995 = 100) | 100 | 104 | 109 | 112 | 118 | 123 | 127 | 132 | 135 | 141 |
| Total energy intensity - Slovenia | Index (1995 = 100) | 100 | 101 | 100 | 94 | 89 | 86 | 87 | 84 | 83 | 82 |
| Total energy intensity - EU28 | Index (1995 = 100) | 100 | 102 | 98 | 96 | 92 | 90 | 90 | 88 | 89 | 88 |
| 2005 | 2006 | 2007 | 2008 | 2009 | 2010 | 2011 | 2012 | 2013 | 2014 | ||
| Total primary energy supply | ktoe | 7207 | 7213 | 7243 | 7650 | 7082 | 7218 | 7279 | 7015 | 6801 | 6593 |
| GDP constant prices of the previous year, reference year 2005 | mio EUR | 29227 | 30880 | 33023 | 34113 | 31453 | 31842 | 32049 | 31178 | 30848 | 31789 |
| Total energy intensity - Slovenia | toe/mio EUR 2005 | 247 | 234 | 219 | 224 | 225 | 227 | 227 | 225 | 220 | 207 |
| Total energy intensity - EU28 | toe/mio EUR 2005 | 164 | 159 | 152 | 151 | 149 | 152 | 144 | 143 | 142 | |
| Total primary energy supply | Index (1995 = 100) | 119 | 119 | 120 | 126 | 117 | 119 | 120 | 116 | 112 | 109 |
| GDP constant prices of the previous year, reference year 2000 | Index (1995 = 100) | 147 | 155 | 166 | 172 | 158 | 160 | 161 | 157 | 155 | 160 |
| Total energy intensity - Slovenia | Index (1995 = 100) | 81 | 77 | 72 | 74 | 74 | 74 | 74 | 74 | 72 | 68 |
| Total energy intensity - EU28 | Index (1995 = 100) | 86 | 84 | 80 | 79 | 78 | 80 | 76 | 75 | 74 |
Eurostat, The Jožef Stefan Institute, 2015
| EU-28 | EU-15 | EU-10 | - | Estonia | Finland | Bulgaria | Czech Republic | Belgium | Slovakia | ||
|---|---|---|---|---|---|---|---|---|---|---|---|
| Total energy intensity 2013 | toe/PPS | 128 | 124 | 154 | 268 | 231 | 226 | 205 | 182 | 174 | |
| SLOVENIA | Sweden | Poland | Hungary | Netherlands | France | Romania | Latvia | Lithuania | Cyprus | ||
| Total energy intensity 2013 | toe/PPS | 169 | 165 | 164 | 155 | 149 | 146 | 144 | 140 | 140 | 133 |
| Luxembourg | Croatia | Germany | Austria | Greece | Malta | Portugal | Spain | United Kingdom | Italy | ||
| Total energy intensity 2013 | toe/PPS | 132 | 131 | 127 | 125 | 124 | 124 | 115 | 115 | 114 | 113 |
| Denmark | Ireland | ||||||||||
| Total energy intensity 2013 | toe/PPS | 108 | 93 |
EUROSTAT, The Jožef Stefan Institute, 2015
| EU-28 | EU-15 | EU-10 | - | Austria | Netherlands | Italy | Luxembourg | Portugal | France | ||
|---|---|---|---|---|---|---|---|---|---|---|---|
| TEI change 2000-2013 (%) | % | -17 | -16 | -29 | -3 | -5 | -8 | -11 | -11 | -12 | |
| TEI 2000 | toe/mio EUR 2005 | 170 | 153 | 424 | 128 | 157 | 127 | 144 | 171 | 162 | |
| TEI 2013 | toe/mio EUR 2005 | 142 | 129 | 299 | 124 | 149 | 117 | 128 | 151 | 143 | |
| Finland | Denmark | Greece | SLOVENIA | Malta | Germany | Belgium | Estonia | Croatia | Spain | ||
| TEI change 2000-2013 (%) | % | -13 | -15 | -15 | -16 | -17 | -18 | -18 | -18 | -18 | -19 |
| TEI 2000 | toe/mio EUR 2005 | 235 | 101 | 179 | 268 | 173 | 159 | 212 | 627 | 269 | 160 |
| TEI 2013 | toe/mio EUR 2005 | 206 | 87 | 151 | 226 | 144 | 131 | 173 | 513 | 219 | 129 |
| Sweden | Cyprus | Czech Republic | Hungary | Ireland | United Kingdom | Latvia | Poland | Bulgaria | Slovakia | ||
| TEI change 2000-2013 (%) | % | -23 | -26 | -26 | -27 | -27 | -28 | -30 | -30 | -41 | -44 |
| TEI 2000 | toe/mio EUR 2005 | 187 | 208 | 480 | 350 | 112 | 143 | 443 | 422 | 1040 | 604 |
| TEI 2013 | toe/mio EUR 2005 | 144 | 154 | 354 | 257 | 82 | 103 | 311 | 295 | 611 | 337 |
| Romania | Lithuania | ||||||||||
| TEI change 2000-2013 (%) | % | -45 | -46 | ||||||||
| TEI 2000 | toe/mio EUR 2005 | 606 | 490 | ||||||||
| TEI 2013 | toe/mio EUR 2005 | 335 | 266 |
| EU-28 | EU-15 | EU-10 | - | Luxembourg | Finland | Sweden | Belgium | Estonia | Netherlands | ||
|---|---|---|---|---|---|---|---|---|---|---|---|
| Total energy consuomption per capita 2013 | toe/capita | 3 | 6 | 1 | 8 | 6 | 5 | 5 | 5 | 5 | |
| Czech Republic | Austria | France | Germany | SLOVENIA | Denmark | Slovakia | United Kingdom | Ireland | Italy | ||
| Total energy consuomption per capita 2013 | toe/capita | 4 | 4 | 4 | 4 | 3 | 3 | 3 | 3 | 3 | 3 |
| Poland | Spain | Cyprus | Bulgaria | Hungary | Lithuania | Greece | Latvia | Portugal | Malta | ||
| Total energy consuomption per capita 2013 | toe/capita | 3 | 3 | 3 | 2 | 2 | 2 | 2 | 2 | 2 | 2 |
| Croatia | Romania | ||||||||||
| Total energy consuomption per capita 2013 | toe/capita | 2 | 2 |
Goals
- Promotion of energy saving and energy efficiency, with an emphasis on the public sector, are stated among the goals in Slovenia's Development Strategy from 2005;
- Improvement of energy efficiency is stated as one of the goals in the Resolution on the National Energy Programme from 2004;
- Quantitative goals for the improvement of energy efficiency are set by the Directive on Energy End-use Efficiency and Energy Services. In the period 2008–2018, Member States shall aim to achieve an energy savings target of 9% in relation to final energy consumption in the base year of 2008.
- Based on the Energy Efficiency Directive, Slovenia set the following 2020 energy consumption goals: 5,188 ktoe for final energy consumption and 7,125 ktoe for energy supply.
Comment
In 2014, Slovenia required 207 toe of primary energy per million EUR of GDP (2005 Constant Prices), which was a 5.9% decrease from the previous year. After 1997, an increase in energy intensity was recorded in 2001 (+1.3%) and in the period 2008–2011 (2.2%, 0.4%, 0.7 % and 0.2%). The largest decrease occurred in the second half of the 1990s, while after 2000, the decrease rate was more moderate. A more notable decrease in intensity was recorded again in 2006 and 2007, while during the economic crisis (2008–2011) the trend was not very pronounced. In recent years, the intensity has been decreasing again, most notably in 2014. In the period 2008–2014, the average annual decrease in energy intensity was 1.3%. In the period 2008–2102, the decrease in energy intensity came to a halt, which represented a temporary deviation from the desired trend, i.e. approaching the EU-28 average. In 2013 and especially in 2014, however, Slovenia caught up with the EU-28. Trends in energy intensity are affected by trends in intensity of final energy consumption (See indicator EN15 Final energy consumption intensity) and trends in the efficiency of systems of production, transport and distribution of electricity and heat (see indicator EN31 Efficiency of systems of production, transport and distribution of electricity and heat).
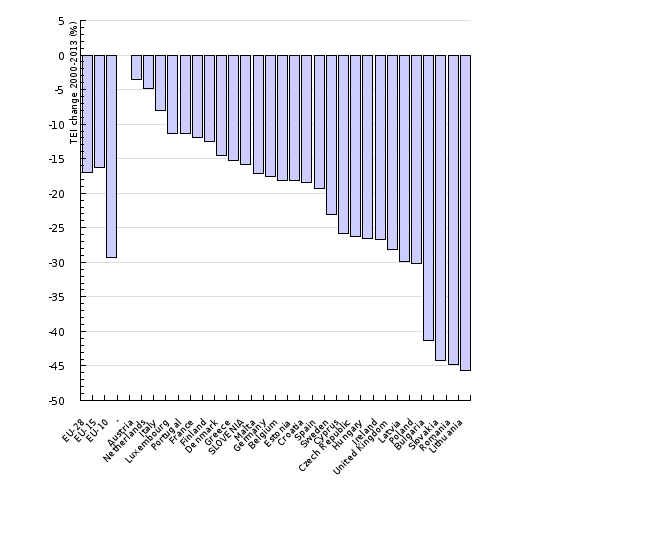
In 2013, the EU-28 required 142 toe of primary energy per million EUR of GDP (2005 Constant Prices), which was a 1.3% decrease from the previous year. Therefore, Slovenia required approximately 59%[1] more energy to achieve the result that equals the average of the EU-28. In the period 1995–2013, energy intensity in the EU-28 decreased at an average rate of 1.6% annually, while in the period 2005–2013, the average annual rate was 1.8%. In Slovenia, energy intensity in the period 1995–2013 decreased at an average annual rate of 1.8%, while in the period 2005–2012, the average annual rate of decrease was 1.5%.
While energy intensity of the Slovenian economy in the period 1995–2013 approached that of the EU-28, it did so only by 5 percentage points. In the period 2007–2011, the energy intensity of the Slovenian economy moved away from that of the EU-28, while in 2012 the reverse trend was observed again.
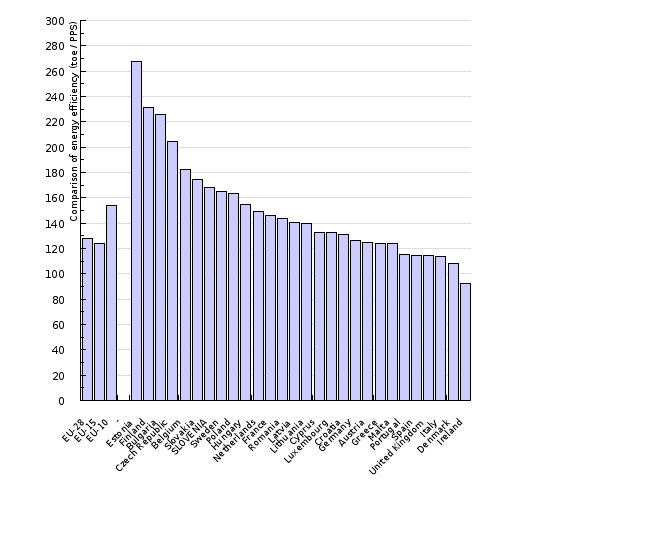
The comparison of energy intensity calculated from GDP and expressed in constant purchasing power units shows that the intensity of the Slovenian economy in 2013 exceeded that of the EU-28 by 32%. Differences among the Member States are substantial as well. The least energy intensive Member State, Ireland, consumes 1.89- times less energy for the same GDP in standard purchasing power units as the most energy intensive Member State, Estonia. Slovenia is among the more energy-wasteful Member States.
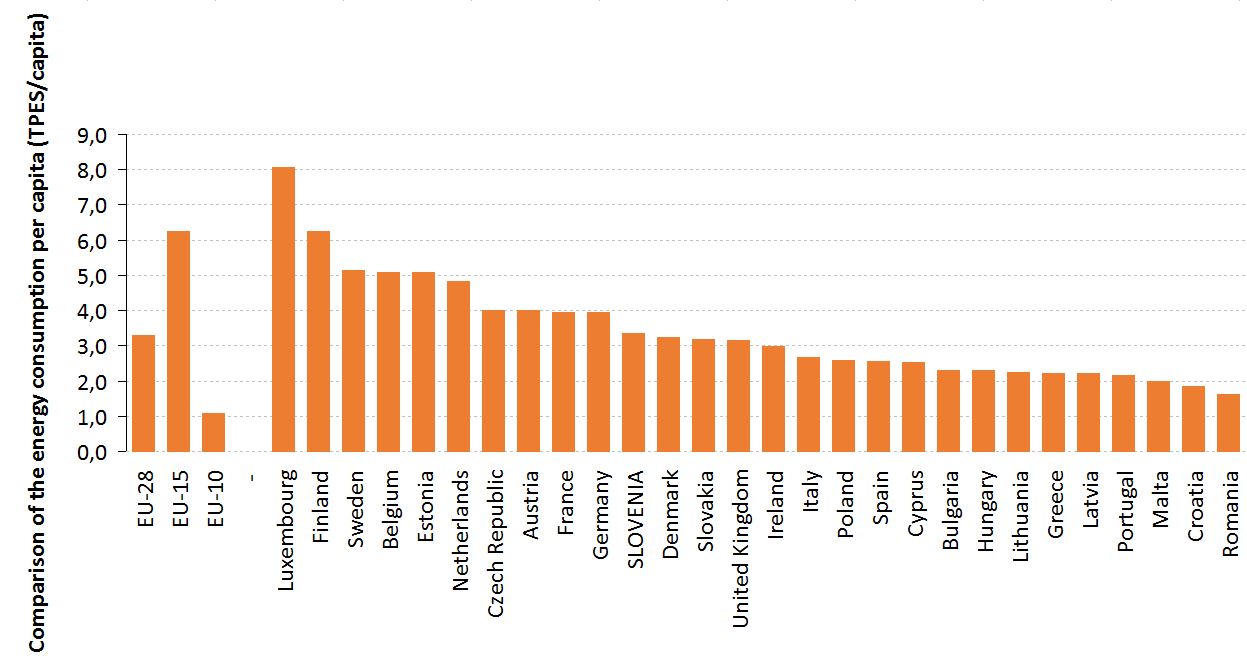
Slovenia's high energy intensity can be attributed to a relatively low GDP per capita with regard to the EU average, a high share of industry in the GDP and the impact of transit transport. As regards energy consumption per capita, Slovenia is close to the EU-28 average (in 2013, consumption in Slovenia was 1.5% higher). Similar energy consumption can be seen for example in Denmark, which, however, has a considerably higher GDP in standard purchasing power units and, consequently, a lower energy intensity.
Primary energy consumption per capita in Slovenia is 3.3 toe, which equals the EU-28 average. The EU-15 average is as much as 6.3 toe per capita.
[1] For the comparison between energy intensity in the EU-28 and Slovenia, the value for Slovenia (226 toe) was calculated from the EUROSTAT data, which differs slightly from the value (220 toe/million [2005] EUR) calculated from the data provided by the Statistical Office of the Republic of Slovenia.


