[PG06] Household expenditure

Key message

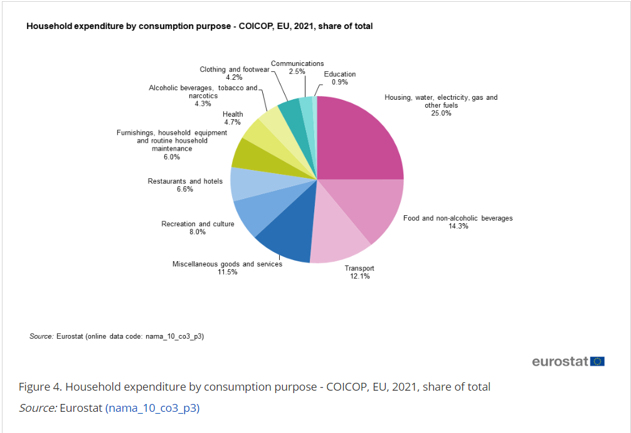
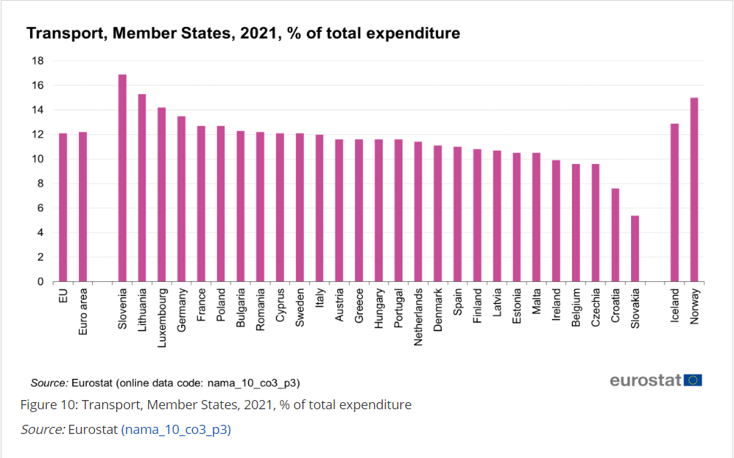
On average, households expenditure by consumption purpose in Slovenia was devoted predominantly on transport, housing, food and non-alcoholic beverages, which is similar to spending in the EU. The majority, a fifth of household spending, consisted of transport expenses. Energy poverty is present in approximately 7% of households, which is around 62,000 households or 102,000 inhabitants. Statistics show that households are among the largest polluters with emissions into the air (in particular with CO2, HFC, NMVOC, CO and particulate matter) and from all sector activities pay the most environmental taxes.
Charts
13 (13 OSEBNE STORITVE, SOCIALNA ZAŠČITA IN RAZNOVRSTNO BLAGO IN STORITVE)
| Food and non-alcoholic beverages[% ] | Alcoholic beverages, tobacco, narcotics[%] | Clothing and footwear[%] | Housing, water, electricity, gas and other fuels[%] | Furnishings, househould equipment and routine household maintenance [%] | Health[%] | Transport[%] | Communication[%] | Recreation and culture[%] | Education[%] | Hotels and restaurants[%] | Personal services, social protection and miscellaneous goods and services (from 2022 onwards, goods and services until this year)[%] | Insurance and financial services[%] | |
|---|---|---|---|---|---|---|---|---|---|---|---|---|---|
| 2000 | 20.20 | 2.12 | 9.04 | 11.17 | 7.60 | 1.84 | 17.85 | 3.17 | 9.46 | 0.91 | 5.81 | 10.84 | |
| 2003 | 18.37 | 2.27 | 8.64 | 11.67 | 6.82 | 1.77 | 17.05 | 4.58 | 11.01 | 0.94 | 5.89 | 10.99 | |
| 2005 | 16.64 | 2.43 | 8.02 | 12.14 | 7.27 | 1.70 | 19.15 | 5.00 | 10.89 | 1.05 | 4.67 | 11.04 | |
| 2007 | 16.48 | 2.50 | 8.12 | 12.80 | 7.80 | 1.92 | 18.08 | 5.27 | 10.58 | 0.96 | 4.08 | 11.43 | |
| 2010 | 16.35 | 2.18 | 7.47 | 13.84 | 7.32 | 2.58 | 16.65 | 5.20 | 11.28 | 1.01 | 4.49 | 11.63 | |
| 2012 | 16.38 | 2.12 | 6.69 | 15.63 | 5.40 | 2.67 | 19.28 | 5.67 | 10.03 | 1.05 | 3.61 | 11.46 | |
| 2015 | 15.40 | 2.10 | 6.70 | 14.80 | 5 | 2.50 | 20.80 | 5.70 | 8.50 | 1 | 5.70 | 11.90 | |
| 2018 | 14.40 | 1.80 | 6.70 | 14 | 5.70 | 2.90 | 21.40 | 5.20 | 9.10 | 1 | 6.60 | 11.20 | |
| 2022 | 17.04 | 2.03 | 7.05 | 12.32 | 5.82 | 3.36 | 21.35 | 5.97 | 6.75 | 0.85 | 6.82 | 6.90 | 3.70 |
Statistical Office of the Republic of Slovenia (2nd July, 2023)
| 1 Share of energy poor households [%] | 1.1 Share of households below at-risk-of-poverty threshold[%] | 1.2 Share of households that are financially unable to keep home adequately warm [%] | 1.3 Share of households that are unable to pay utility bills (waste disposal, water, electricity, heating, etc.) on time due to financial difficulties[%] | 1.4 Share of households having problems with leaking roofs, damp walls/floors/foundations or broken window frames/floors in their dwellings[%] | |
|---|---|---|---|---|---|
| 2014 | 10.90 | 18.20 | 6.90 | 18.20 | 30.20 |
| 2015 | 10.30 | 18.60 | 6.60 | 15.70 | 26.90 |
| 2016 | 10.10 | 18.80 | 6 | 14.80 | 23.80 |
| 2017 | 9.30 | 18.20 | 5.20 | 13 | 22.80 |
| 2018 | 9.30 | 18.80 | 4.50 | 11.50 | 23 |
| 2019 | 7.70 | 17.50 | 3 | 10.60 | 21 |
| 2020 | 7.50 | 18 | 3.90 | 8.70 | 21.90 |
| 2021 | 6.50 | 16.40 | 2.30 | 7.40 | 19.70 |
| 2022 | 7.20 | 17.80 | 3.50 | 6.30 | 17.80 |
Statistical Office of the Republic of Slovenia (2nd July, 2023)
| A heavy burden[%] | Somewhat a burden[%] | Not burden at all[%] | |
|---|---|---|---|
| 2008 | 35 | 51 | 14 |
| 2009 | 36 | 53 | 11 |
| 2010 | 37 | 52 | 11 |
| 2011 | 40 | 51 | 10 |
| 2012 | 36 | 53 | 11 |
| 2013 | 38 | 52 | 10 |
| 2014 | 37 | 52 | 12 |
| 2015 | 33 | 53 | 15 |
| 2016 | 32 | 53 | 15 |
| 2017 | 36 | 53 | 12 |
| 2018 | 35 | 53 | 12 |
| 2019 | 32 | 53 | 15 |
| 2020 | 27 | 59 | 14 |
| 2021 | 22 | 60 | 19 |
| 2022 | 25 | 59 | 17 |
Statistical Office of the Republic of Slovenia (2nd July, 2023)
| Agriculture, forestry, fishing[Gg, Mg] | Mining and quarrying[Gg, Mg] | Manufacturing[Gg, Mg] | Electricity, gas, steam and conditioning supply[Gg, Mg] | Water supply; sewarage, waste management and remediation activities[Gg, Mg] | Construction[Gg, Mg] | Wholesale and retail trade; repair of motor vehicles and motorcycles[Gg, Mg] | Transport and storage[Gg, Mg] | Accomodation and food service activities[Gg, Mg] | Information and communication [Gg, Mg] | Financial and insurance activities[Gg, Mg] | Real estate activities[Gg, Mg] | Professional, scientific and technical activities[Gg, Mg] | Public administration and defense; compulsory social security[Gg, Mg] | Education[Gg, Mg] | Human health and social work activities[Gg, Mg] | R Arts, entertainment and recreational activities[Gg, Mg] | Household [Gg, Mg] | |
|---|---|---|---|---|---|---|---|---|---|---|---|---|---|---|---|---|---|---|
| CO2 (Gg) | 270.30 | 86.70 | 2679.40 | 4571.60 | 70 | 587.40 | 444 | 907.20 | 89.50 | 44.90 | 53.40 | 34.80 | 157.40 | 42.40 | 62.20 | 77.80 | 29.40 | 3050.30 |
| Biomasa CO2 (Gg) | 1.80 | 0.30 | 432.10 | 332 | 3.20 | 35.10 | 27.60 | 50.80 | 3.80 | 2.50 | 2.90 | 1.10 | 7.30 | 1.40 | 1.80 | 2 | 1.20 | 1958.80 |
| N2O (Mg) | 1824.20 | 3 | 53 | 73.10 | 157.90 | 45.30 | 19.60 | 44.40 | 2.30 | 1.60 | 1.80 | 0.60 | 4.50 | 0.70 | 0.90 | 222.70 | 0.70 | 143.10 |
| CH4 (Mg) | 46941 | 8665.30 | 215.90 | 1687 | 13951.90 | 12.80 | 7.10 | 14.90 | 5.60 | 1.60 | 2.20 | 2.90 | 8.60 | 3.60 | 5.70 | 7.90 | 2 | 4195 |
| HFC (Mg) | 0 | 0 | 43660.70 | 0 | 16007.50 | 0 | 0 | 1491.90 | 17239.20 | 2652.20 | 3481 | 9945.70 | 22046.30 | 11769.10 | 19559.80 | 27350.60 | 5801.60 | 106519.80 |
| NOx (Mg) | 4725.70 | 101.60 | 4539.30 | 3392.10 | 104.40 | 1589.70 | 858.30 | 2675.30 | 218.60 | 94.70 | 114.30 | 93.20 | 365 | 117.90 | 171.90 | 222.50 | 72.70 | 6621.10 |
| SOx (Mg) | 2.60 | 0.20 | 1881.20 | 1570.60 | 0.80 | 13.90 | 2.50 | 209.80 | 16 | 2.60 | 3.40 | 9.10 | 20.70 | 11.90 | 17.90 | 25 | 5.40 | 405.50 |
| NH3 (Mg) | 16853.70 | 0.10 | 27.50 | 0.40 | 46.10 | 7.90 | 8.30 | 11 | 1.20 | 1.10 | 1.50 | 0.30 | 3.30 | 0.60 | 0.60 | 0.70 | 0.60 | 1184.70 |
| NMVOC (Mg) | 7218 | 1035.90 | 8406.50 | 158.90 | 209.70 | 327.80 | 192.70 | 570.20 | 36.10 | 20.80 | 26 | 12.90 | 69.50 | 19.30 | 23.70 | 28.90 | 12.70 | 12604.20 |
| CO (Mg) | 3442.30 | 35 | 11263.40 | 1354.60 | 33.30 | 745.90 | 430 | 12213.20 | 108.50 | 69.10 | 100 | 39.10 | 241.90 | 96.20 | 82.80 | 104.20 | 47.20 | 66641.60 |
| PM10 (Mg) | 752.60 | 733.10 | 930.10 | 344 | 128.30 | 3087 | 105.30 | 221.30 | 18.80 | 9.90 | 11.50 | 6.90 | 33.20 | 8.40 | 12 | 14.60 | 6 | 8119.20 |
| PM2,5 (Mg) | 375.60 | 80.90 | 829.40 | 299 | 123.40 | 410.30 | 63.60 | 141.20 | 13.30 | 6.40 | 7.60 | 5.30 | 22.90 | 6.50 | 9.40 | 11.90 | 4.30 | 7788.80 |
Statistical Office of the Republic of Slovenia (2nd July, 2023)
| Agriculture, forestry, fishing[mio EUR] | Mining and quarrying[mio EUR] | Manufacturing[mio EUR] | Electricity, gas, steam and conditioning supply[mio EUR] | Water supply; sewarage, waste management and remediation activities[mio EUR] | Construction[mio EUR] | Wholesale and retail trade; repair of motor vehicles and motorcycles[mio EUR] | Transport and storage[mio EUR] | Accomodation and food service activities[mio EUR] | Information and communication [mio EUR] | Financial and insurance activities[mio EUR] | Real estate activities[mio EUR] | Professional, scientific and technical activities[mio EUR] | Public administration and defense; compulsory social security[mio EUR] | Education[mio EUR] | Human health and social work activities[mio EUR] | Arts, entertainment and recreational activities[mio EUR] | Household [mio EUR] | |
|---|---|---|---|---|---|---|---|---|---|---|---|---|---|---|---|---|---|---|
| 2008 | 0.79 | 0.27 | 131.44 | 33.08 | 9.77 | 3.80 | 74.45 | 46.75 | 0.74 | 0.37 | 9.88 | 0.31 | 1.69 | 0.60 | 0.29 | 0.59 | 0.19 | 704.72 |
| 2009 | 0.69 | 0.26 | 151.11 | 30.60 | 9.51 | 4.02 | 45.41 | 52.27 | 0.88 | 0.37 | 9.49 | 0.25 | 1.62 | 1.17 | 0.30 | 0.56 | 0.20 | 825.70 |
| 2012 | 0.80 | 0.49 | 161.14 | 66.08 | 10.22 | 12.83 | 75.69 | 67.44 | 0.94 | 0.37 | 8.72 | 0.33 | 1.35 | 1.21 | 0.33 | 0.44 | 0.34 | 888.95 |
| 2015 | 1.62 | 1.20 | 207.80 | 122.75 | 12.91 | 15.22 | 67.91 | 80.45 | 1.48 | 0.49 | 8.94 | 0.56 | 2.50 | 1.51 | 0.58 | 0.72 | 0.58 | 863.64 |
| 2016 | 2.44 | 1.13 | 221.99 | 107.87 | 12.28 | 16.07 | 64.80 | 96.93 | 1.72 | 0.50 | 8.99 | 0.56 | 2.04 | 1.49 | 0.68 | 0.88 | 0.58 | 900.80 |
| 2019 | 2.56 | 1.66 | 222.44 | 136.46 | 12.72 | 16.79 | 79.14 | 120.10 | 1.77 | 0.86 | 6.85 | 0.61 | 2.87 | 2.06 | 0.94 | 1.21 | 0.64 | 876.47 |
| 2020 | 2.29 | 1.57 | 183.45 | 129.75 | 12.57 | 14.80 | 66 | 104.59 | 1.71 | 0.85 | 6.79 | 0.60 | 3.02 | 1.83 | 0.83 | 1.16 | 0.61 | 803.07 |
| 2021 | 2.39 | 1.63 | 217.68 | 132.04 | 12.29 | 17.29 | 42.60 | 116.32 | 1.66 | 0.79 | 6.63 | 0.56 | 2.57 | 1.82 | 0.84 | 1.17 | 0.60 | 831.58 |
Eurostat (2nd July, 2023)
Eurostat (2nd July, 2023)


