[EN21] Energy taxes

Key message

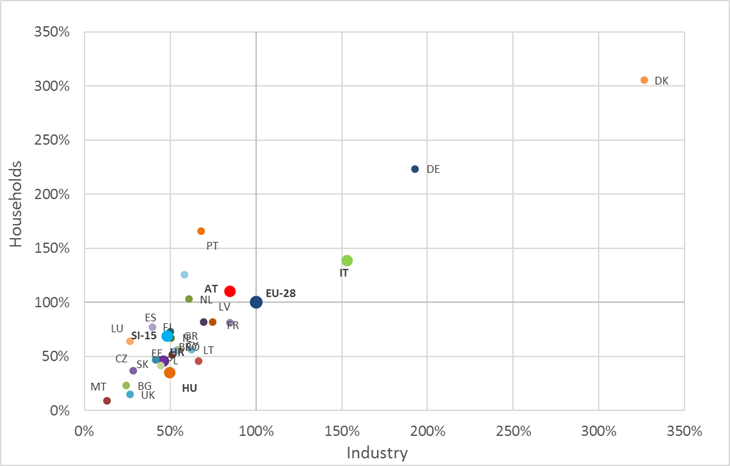
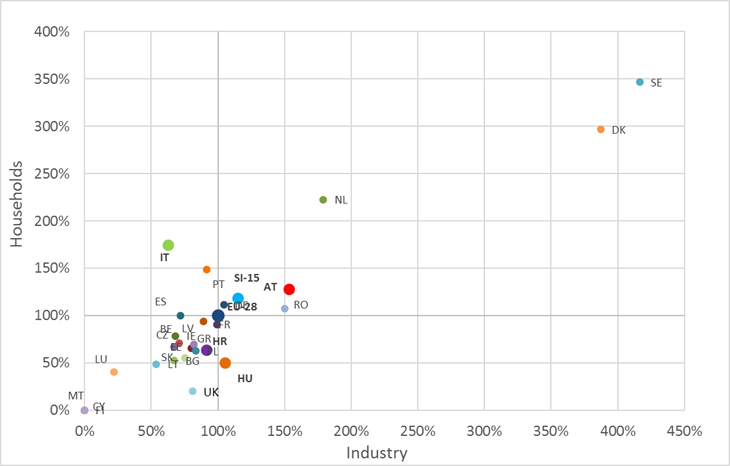
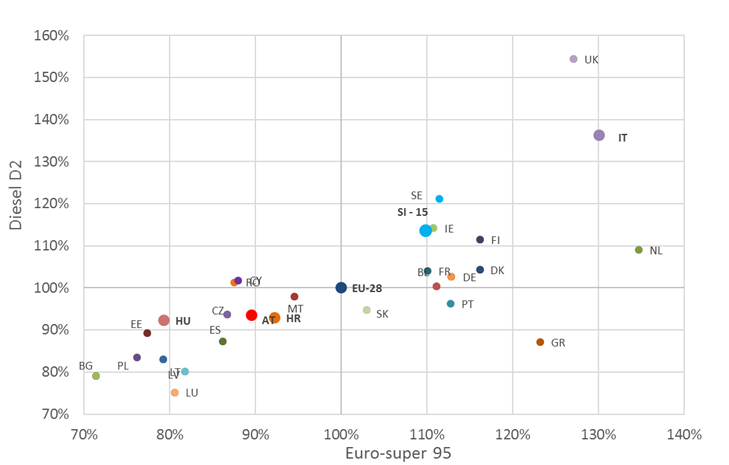
In recent years, energy taxes have increased mainly due to higher excise duties and taxes. The share of tax in the price of energy in industry has reached the same level as in the price paid by households. In Slovenia, taxes on transport fuels and electricity were below the EU-27 average, while taxes on natural gas in industry and households were above that average, exceeded only by Austria, Italy, Denmark and Sweden.
Definition
This indicator shows the level of taxation for individual energy products. Electricity tax is expressed in EUR per kilowatt hour (EUR/kWh), natural gas tax in EUR per gigajoule (EUR/GJ) and liquid fuel tax in EUR per litre of fuel (EUR/l).
Electricity and natural gas taxes show the level of taxation for typical consumer groups within industrial and household consumers; however, the tax for industrial consumers does not include the value-added tax (VAT).
Charts
| 1995-2007 | 2008-2015 | |
|---|---|---|
| electricity - households | 102.98 | 85.24 |
| electricity - industry | -100 | 248.99 |
| Diesel D2 - transport | 75.99 | 50.89 |
| fuel oil - heating | 340.93 | 124.79 |
| natural gas - industry | 223.99 | 51.37 |
| Petrol NMB 95 - transport | 101.92 | 47.08 |
| natural gas - households | 779.33 | 37.06 |
| electricity - households | electricity - industry | |
|---|---|---|
| 1992 | 0.01 | 0.01 |
| 1993 | 0.01 | 0.00 |
| 1994 | 0.01 | 0.00 |
| 1995 | 0.01 | 0.01 |
| 1996 | 0.01 | 0.01 |
| 1997 | 0.01 | 0.01 |
| 1998 | 0.01 | 0.01 |
| 1999 | 0.01 | 0.01 |
| 2000 | 0.01 | 0 |
| 2001 | 0.01 | 0 |
| 2002 | 0.01 | 0 |
| 2003 | 0.01 | 0 |
| 2004 | 0.01 | 0 |
| 2005 | 0.01 | 0 |
| 2006 | 0.01 | 0 |
| 2007 | 0.01 | 0 |
| 2008 | 0.02 | 0.00 |
| 2009 | 0.02 | 0.00 |
| 2010 | 0.03 | 0.01 |
| 2011 | 0.03 | 0.01 |
| 2012 | 0.03 | 0.01 |
| 2013 | 0.03 | 0.01 |
| 2014 | 0.03 | 0.01 |
| 2015 | 0.03 | 0.01 |
| natural gas - households | natural gas - industry | |
|---|---|---|
| 1995 | 0.27 | 0.19 |
| 1996 | 0.25 | 0.17 |
| 1997 | 0.43 | 0.35 |
| 1998 | 0.46 | 0.42 |
| 1999 | 0.74 | 0.68 |
| 2000 | 1.50 | 0.47 |
| 2001 | 2.12 | 0.62 |
| 2002 | 2.11 | 0.73 |
| 2003 | 2.07 | 0.69 |
| 2004 | 2.01 | 0.67 |
| 2005 | 2.09 | 0.66 |
| 2006 | 2.40 | 0.64 |
| 2007 | 2.41 | 0.61 |
| 2008 | 2.51 | 0.59 |
| 2009 | 2.76 | 0.57 |
| 2010 | 2.63 | 0.67 |
| 2011 | 3.12 | 0.89 |
| 2012 | 3.58 | 0.90 |
| 2013 | 3.15 | 0.95 |
| 2014 | 3.31 | 0.95 |
| 2015 | 3.44 | 0.89 |
| Fuel oil - heating | Euro-super 95 | Diesel D2 | |
|---|---|---|---|
| 1995 | 0.03 | 0.21 | 0.21 |
| 1996 | 0.04 | 0.22 | 0.21 |
| 1997 | 0.03 | 0.21 | 0.20 |
| 1998 | 0.05 | 0.26 | 0.24 |
| 1999 | 0.10 | 0.34 | 0.33 |
| 2000 | 0.11 | 0.33 | 0.35 |
| 2001 | 0.13 | 0.39 | 0.35 |
| 2002 | 0.11 | 0.45 | 0.34 |
| 2003 | 0.11 | 0.43 | 0.32 |
| 2004 | 0.12 | 0.44 | 0.36 |
| 2005 | 0.15 | 0.45 | 0.40 |
| 2006 | 0.12 | 0.42 | 0.37 |
| 2007 | 0.11 | 0.43 | 0.37 |
| 2008 | 0.13 | 0.40 | 0.36 |
| 2009 | 0.13 | 0.44 | 0.40 |
| 2010 | 0.15 | 0.50 | 0.45 |
| 2011 | 0.17 | 0.50 | 0.45 |
| 2012 | 0.19 | 0.52 | 0.42 |
| 2013 | 0.22 | 0.59 | 0.52 |
| 2014 | 0.22 | 0.57 | 0.52 |
| 2015 | 0.29 | 0.59 | 0.54 |
| Electricity: households - retail price | Electricity: households - price before taxes | Electricity: households - taxes (with VAT) | Natural gas: households: retail price | Natural gas: households: price before taxes | Natural gas: households: taxes (with VAT) | Diesel D2: transport - retail price | Diesel D2: transport - price before taxes | Diesel D2: transport - taxes (with VAT) | Petrol NMB 95: transport - retail price | Petrol NMB 95: transport - price before taxes | Petrol NMB 95: transport - taxes (with VAT) | Fuel oil EL - retail price | Fuel oil EL - price before taxes | Fuel oil EL - taxes (with VAT) | |
|---|---|---|---|---|---|---|---|---|---|---|---|---|---|---|---|
| 1995-2000 | 15.77 | -100 | -3.68 | 40.50 | 11.62 | 30.80 | 10.65 | 3.36 | -15.10 | 9.28 | 2.60 | -16.80 | 15.36 | 33.38 | 15.36 |
| 2000 - 2007 | -0.34 | -0.34 | -3.68 | 19.86 | 6.94 | 30.80 | 4.82 | 3.36 | -4.78 | 6.03 | 2.60 | -4.59 | 13.16 | 33.38 | 8.74 |
| 2008-2015 | 9.21 | 20.70 | 5.03 | 4.61 | 11.29 | 1.94 | 6.05 | 4.89 | 7.89 | 5.67 | 5.43 | 6.13 | 12.27 | 18.52 | 8.64 |
| 2014 - 2015 | -3.48 | -3.68 | -3.35 | 4.09 | 30.80 | -6.65 | 3.36 | 9.97 | -4.72 | 2.60 | 6.72 | -4.57 | 33.38 | 49.19 | 22.71 |
| 1995 | 2000 | 2015 | |
|---|---|---|---|
| Euro-super 95 | 49.50 | 62.40 | 66.20 |
| Diesel D2 | 51.80 | 60.10 | 64.20 |
| Fuel oul:<br> heating | 11.90 | 33.80 | 48.90 |
| Natural gas:<br> households | 4.80 | 23.30 | 28.20 |
| Electricity:<br> households | 9.10 | 16 | 29.30 |
| Natural gas:<br> industry | 4.80 | 24.30 | 28.20 |
| Electricity:<br> industry | 9.10 | 16 | 28.60 |
| households | industry | |
|---|---|---|
| EU-27 | 100 | 100 |
| BE | 45.44 | 66.39 |
| BG | 23.09 | 24.55 |
| CZ | 36.91 | 28.50 |
| DK | 305.29 | 326.19 |
| DE | 223.53 | 192.75 |
| EE | 51.62 | 51.24 |
| IE | 67.06 | 50.58 |
| GR | 81.76 | 69.69 |
| ES | 72.65 | 50.08 |
| FR | 81.91 | 74.63 |
| CY | 56.32 | 54.70 |
| LV | 81.18 | 84.84 |
| LT | 56.18 | 62.60 |
| LU | 64.12 | 26.52 |
| HU | 35.29 | 49.75 |
| MT | 8.82 | 13.18 |
| NL | 103.09 | 60.79 |
| AT | 110 | 85.01 |
| PL | 46.91 | 41.52 |
| PT | 166.03 | 68.04 |
| RO | 55.29 | 53.05 |
| SI-11 | 68.53 | 48.60 |
| SK | 41.62 | 44.48 |
| FI | 77.35 | 39.54 |
| SE | 98.24 | 26.52 |
| UK | 14.85 | 58.15 |
| IT | 138.68 | 153.21 |
| industry | households | |
|---|---|---|
| EU-28 | 100 | 100 |
| BE | 70.91 | 70.67 |
| BG | 67.27 | 52.67 |
| CZ | 67.27 | 66.67 |
| DK | 387.27 | 296.67 |
| DE | 104.55 | 111.33 |
| EE | 80 | 65.33 |
| IE | 68.18 | 78.67 |
| GR | 99.09 | 90.67 |
| ES | 71.82 | 100 |
| FR | 89.09 | 94 |
| CY | 0 | 0 |
| LV | 81.82 | 69.33 |
| LT | 53.64 | 48.67 |
| LU | 21.82 | 40.67 |
| HU | 105.45 | 50 |
| MT | 0 | 0 |
| NL | 179.09 | 222.67 |
| AT | 153.64 | 127.33 |
| PL | 83.64 | 62.67 |
| PT | 91.82 | 148.67 |
| RO | 150 | 107.33 |
| SI-12 | 115.45 | 118 |
| SK | 75.45 | 55.33 |
| FI | 0 | 0 |
| SE | 416.36 | 346.67 |
| UK | 80.91 | 20 |
| IT | 62.73 | 174.67 |
| D2 | NMB | |
|---|---|---|
| AT | 93.55 | 89.58 |
| BE | 100.31 | 111.13 |
| BG | 78.99 | 71.43 |
| CY | 101.80 | 87.97 |
| CZ | 93.73 | 86.70 |
| DE | 102.59 | 112.84 |
| DK | 104.31 | 116.17 |
| EE | 89.31 | 77.39 |
| ES | 87.27 | 86.16 |
| FI | 111.42 | 116.18 |
| FR | 104.02 | 110.06 |
| GR | 87.12 | 123.21 |
| HU | 92.25 | 79.37 |
| IE | 114.16 | 110.77 |
| IT | 136.17 | 130.12 |
| LT | 80.11 | 81.75 |
| LU | 75.14 | 80.57 |
| LV | 82.96 | 79.26 |
| MT | 97.92 | 94.54 |
| NL | 109.04 | 134.73 |
| PL | 83.41 | 76.22 |
| PT | 96.21 | 112.73 |
| RO | 101.31 | 87.56 |
| SE | 121.17 | 111.42 |
| SI-15 | 113.66 | 109.86 |
| SK | 94.81 | 102.96 |
| UK | 154.40 | 127.09 |
| EU-27 | 100 | 100 |
Goals
Specific objectives with regard to taxation of energy products are set by energy policy at the EU level together with the Directive (2003/96/EC) on the taxation of fuels and electricity. The Directive stipulates the minimum levels of taxation of individual energy products that are mandatory for all Member States. The main purpose of the Directive is to establish better competitiveness between energy products and eliminate price disparities between Member States, which occurred due to differences in the levels of taxation.
Also, the Resolution on the National Energy Programme indicates “green tax reform”; however, the state is still waiting for its implementation.
Comment
In most countries, the basic purpose of energy taxation is fiscal in its nature, as energy taxes represent a substantial source of national budgetary funds. However, the role of energy taxes is not purely budgetary. Energy taxation represents a good way to internalise external costs. By imposing taxes on energy, the state influences the final level of energy prices, through which it directs and indirectly influences energy consumption. By increasing taxes on energy, the state promotes the reduction of energy consumption among final consumers, by which impacts on the environment are reduced. On the other hand, the state interferes with price relationships by imposing taxes on energy, thus influencing the replacement of environmentally harmful fuels with fuels that are environmentally less harmful.
The past and current practice in the shaping of energy taxes shows that they are determined by the state through its fiscal policy while, for the time being, the national energy policy has a secondary role in the shaping of taxes. Currently, energy taxes are the only mechanism available to the state for influencing the final price of individual energy products.
Green tax reform, which would encourage sustainable behaviour in producers as well as consumers is one of the possible answers to challenges related to the deteriorating state of the environment due to false market signals. The purpose of green tax reform is to address the aforementioned problem by redistributing tax burdens from labour taxes to environmental taxes (imposing taxes on the consumption of energy and other resources and raw materials as well as environmentally hazardous substances). A crucial characteristic of green tax reform is that imposing of new environmental taxes does not lead to a general increase in taxes but instead, redistributes the tax burden. Although a system of environmental taxes has been established in Slovenia, a comprehensive green tax reform could contribute to higher energy efficiency.
Generally, energy taxes have been increasing since 1995 in real terms, the only exception being electricity taxes for industrial consumers, where the direct tax burden was reduced due to the introduction of VAT. The most notable changes occurred before 2008. In the period 1995–2008, taxes on natural gas for household consumers increased by almost 800% in real terms (here, it needs to be noted that tax levels in 1995 were relatively low), while taxes on fuel oil increased by slightly less than 350% in real terms.
Households
In Slovenia, taxes on electricity for households were relatively constant in the period 1992–2000. VAT was introduced in 1999, resulting in an almost 50% increase in the level of taxation for households. In 2006, VAT was the only electricity tax paid by households, while in 2017 excise duty was introduced. In the case of natural gas, the growth of taxes was moderate in the period 1995–2000, in which taxes were the main reason for the increasing prices of natural gas. After 2000, taxes on natural gas increased mainly for household consumers. Here, the introductions of CO2 tax and excise duty were the main contributors, while the effect of the introduction of VAT was felt to a lesser degree. The share of taxes in the final electricity price was 22.6% in 2012, which was more than in 2000 and 1995, when the share of taxes represented 16% and 9.1% of final price, respectively. Compared to 2011, the share of taxes in the final electricity price was lower, which was a result of lower excise tax on electricity.
In 2012, the share of taxes in the price of natural gas for households amounted to 22.6%, which was less than a year earlier, when the share was 26.5%.
In 2012, taxes on natural gas for households were 24% above the EU-27 average, while electricity tax was 37% below the EU-27 average.
Industry
In industry, taxes have no longer been considered to be a direct tax burden since the introduction of VAT, which means that after its introduction, taxes on electricity for industrial consumers have no longer been imposed. In 2008, the effect of the introduction of excise duty was already felt. In the period 2000–2007, taxes on natural gas in industry increased, primarily due to the introduction of excise duty and a higher CO2 tax. The share of taxes in the final price for industry is at the level of the share in the final price for households, amounting to 24%. In 2012, the share of taxes in the final price of natural gas was 23.1%, which was more than in 1995 and 2000 when the share was 4.8% and 8.3%, respectively. The share of taxes in the price of electricity for industry was 24.1% in 2012.
In 2012, taxes on natural gas for industrial consumers were 48% above the EU-27 average, while the tax on electricity was 43% below the EU-27 average.
Petroleum products
In the period 1995–2000, the prices of petroleum products rose at a relatively high rate. The introduction of VAT in 1999 was followed by a period of moderate growth, except for NMB 95 gasoline, for which taxes increased until 2002. In the period 1995–2000, the growth of final prices of petroleum products in real terms was primarily a consequence of higher taxes (introduction of excise duty and VAT), while after 2000 taxes have had no significant impact on the growth of final prices. In 2012, the share of taxes in the final energy price of electricity, natural gas and petroleum products was lower compared to 2011. It was also lower compared to 2000 due to a considerable increase of base prices. The share of taxes in the final price of D2 diesel fuel is 44.5%, which is lower compared to 1995, when it was 51.8%, while in 2000 it was 60.1%. The main reason for such a share of taxes in the final price of petroleum products is the introduction of environmental tax for CO2 emissions (in the case of fuel oil), excise duty and VAT.
In 2012, taxes on motor fuels were 8% below the EU-27 average for NMB 95 gasoline and 12% below the EU-27 average for D3 diesel fuel. The comparison with the neighbouring countries shows that in 2012, taxes on motor fuels in Austria and Italy were higher than in Slovenia, while in Hungary they were slightly lower for D3 diesel fuel and higher for NMB 95 gasoline.


