[EN21] Energy taxes

Key message

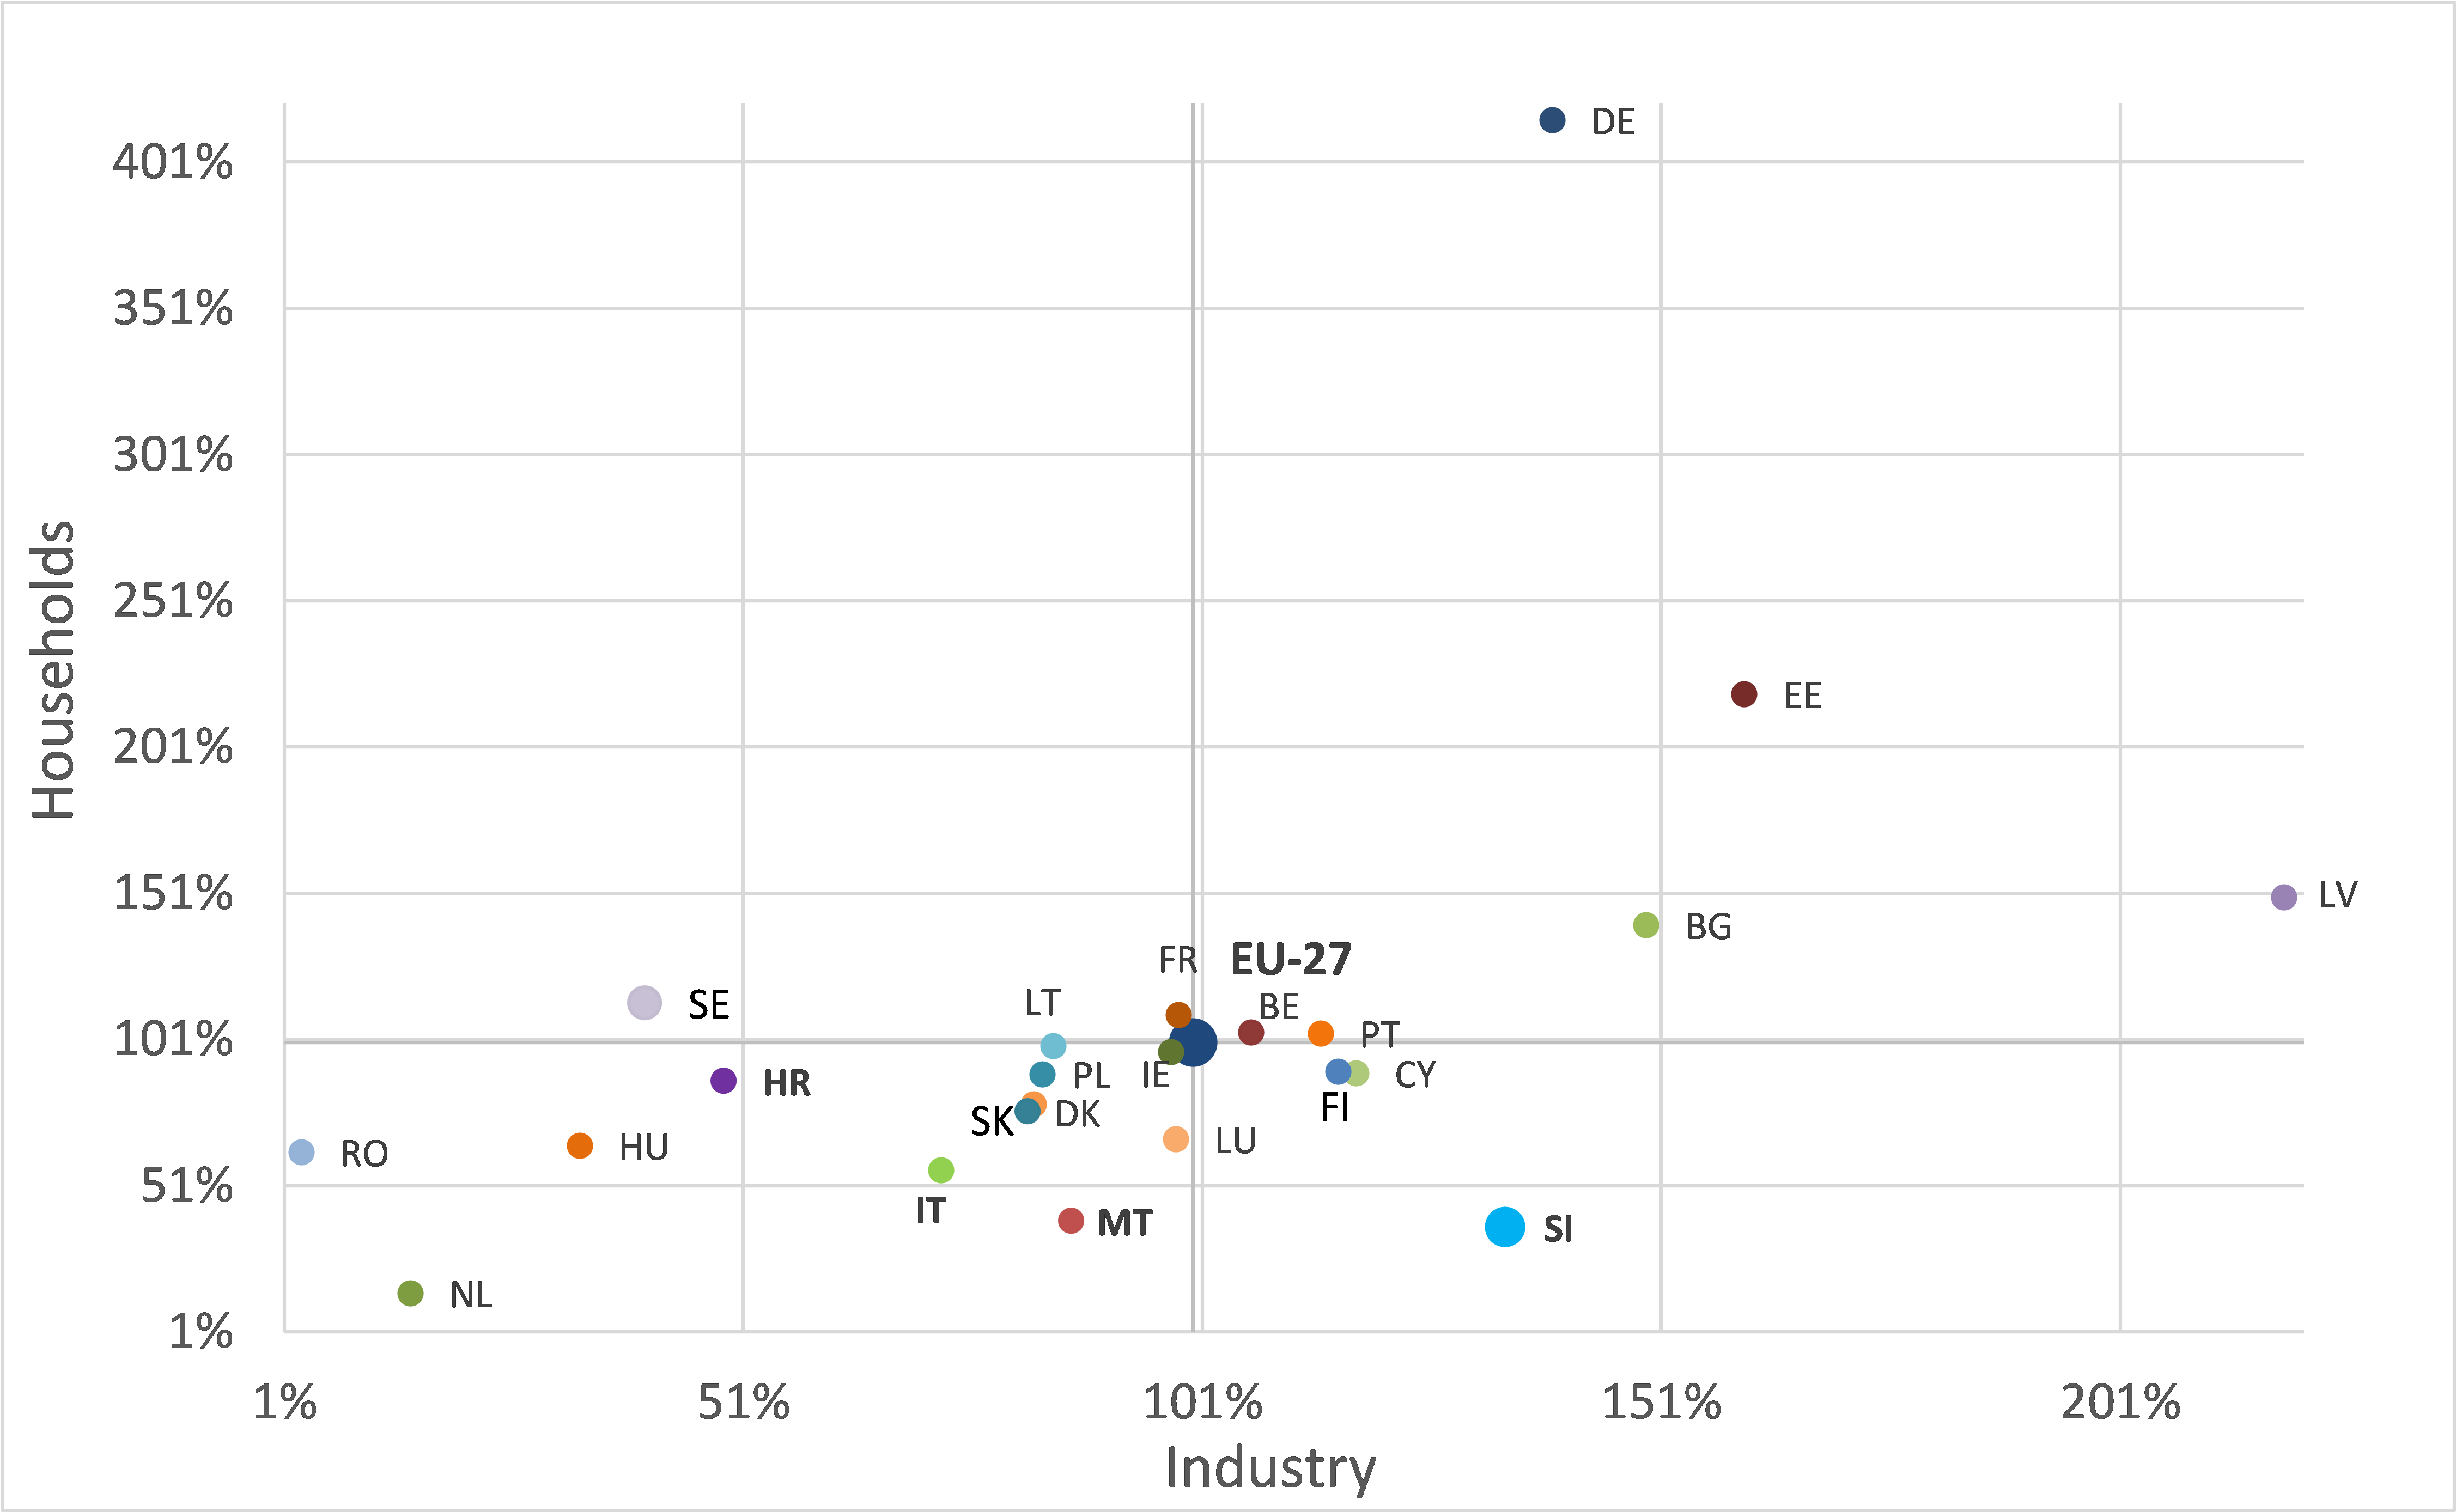
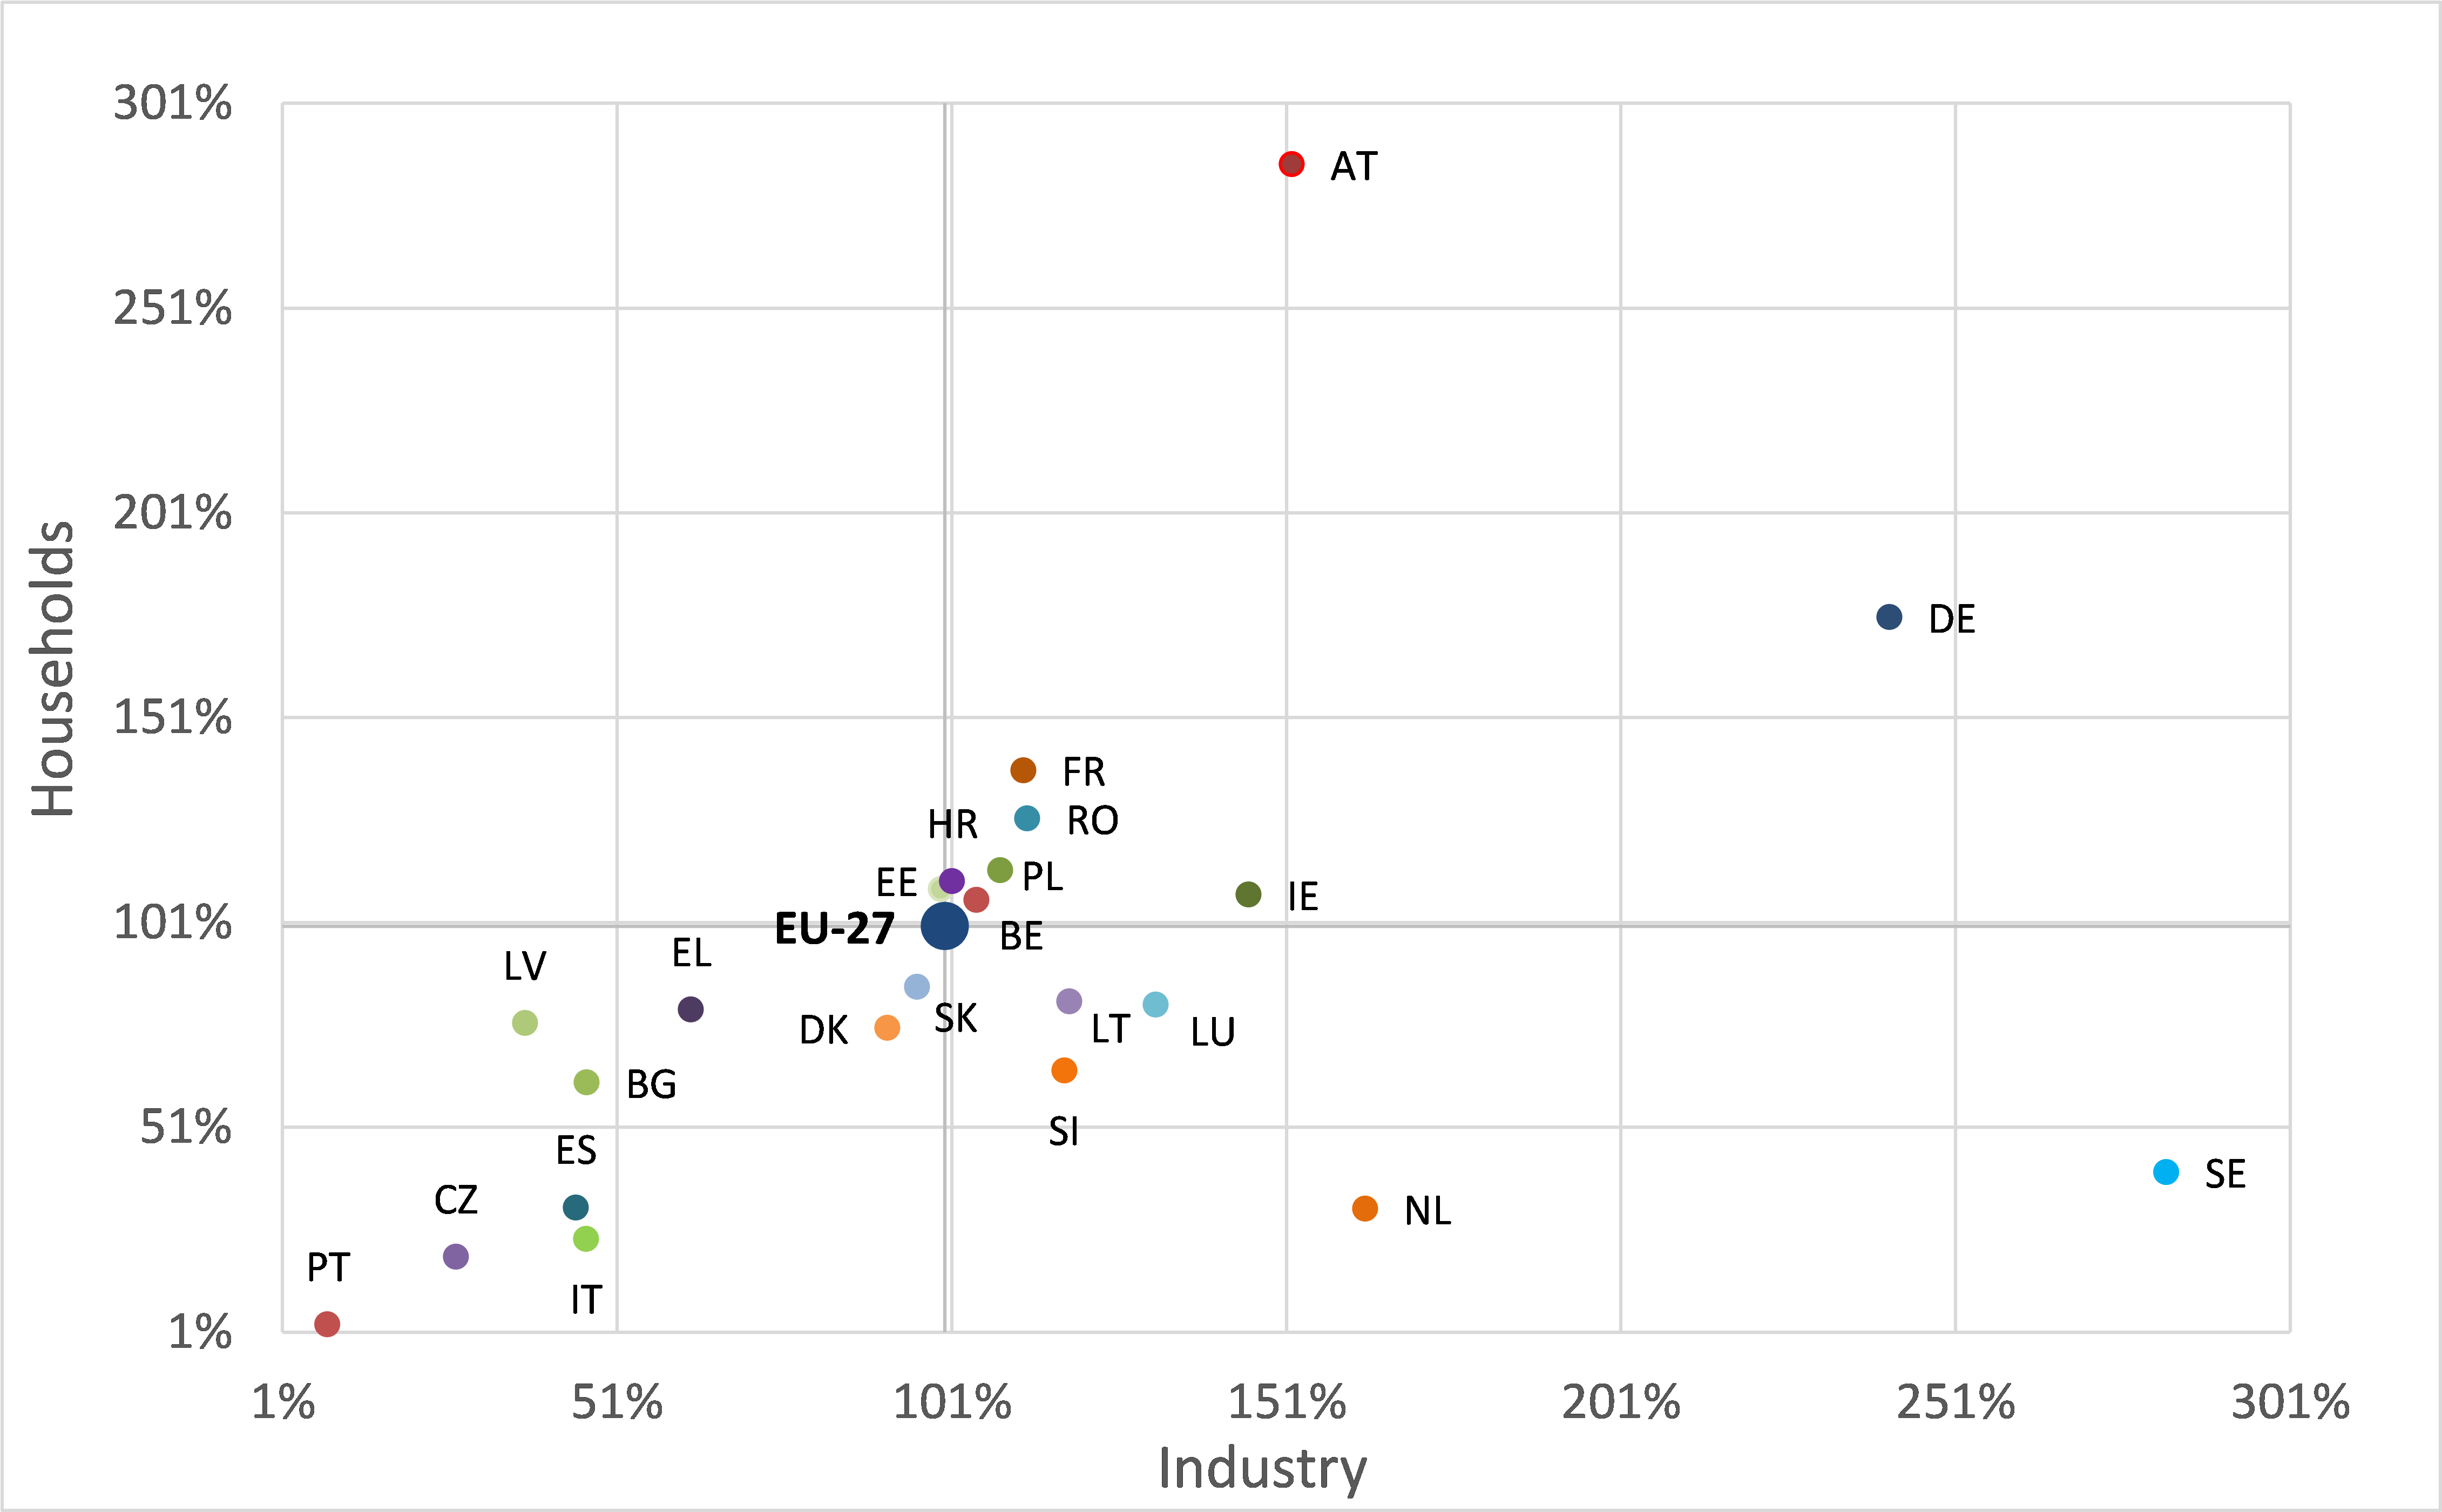
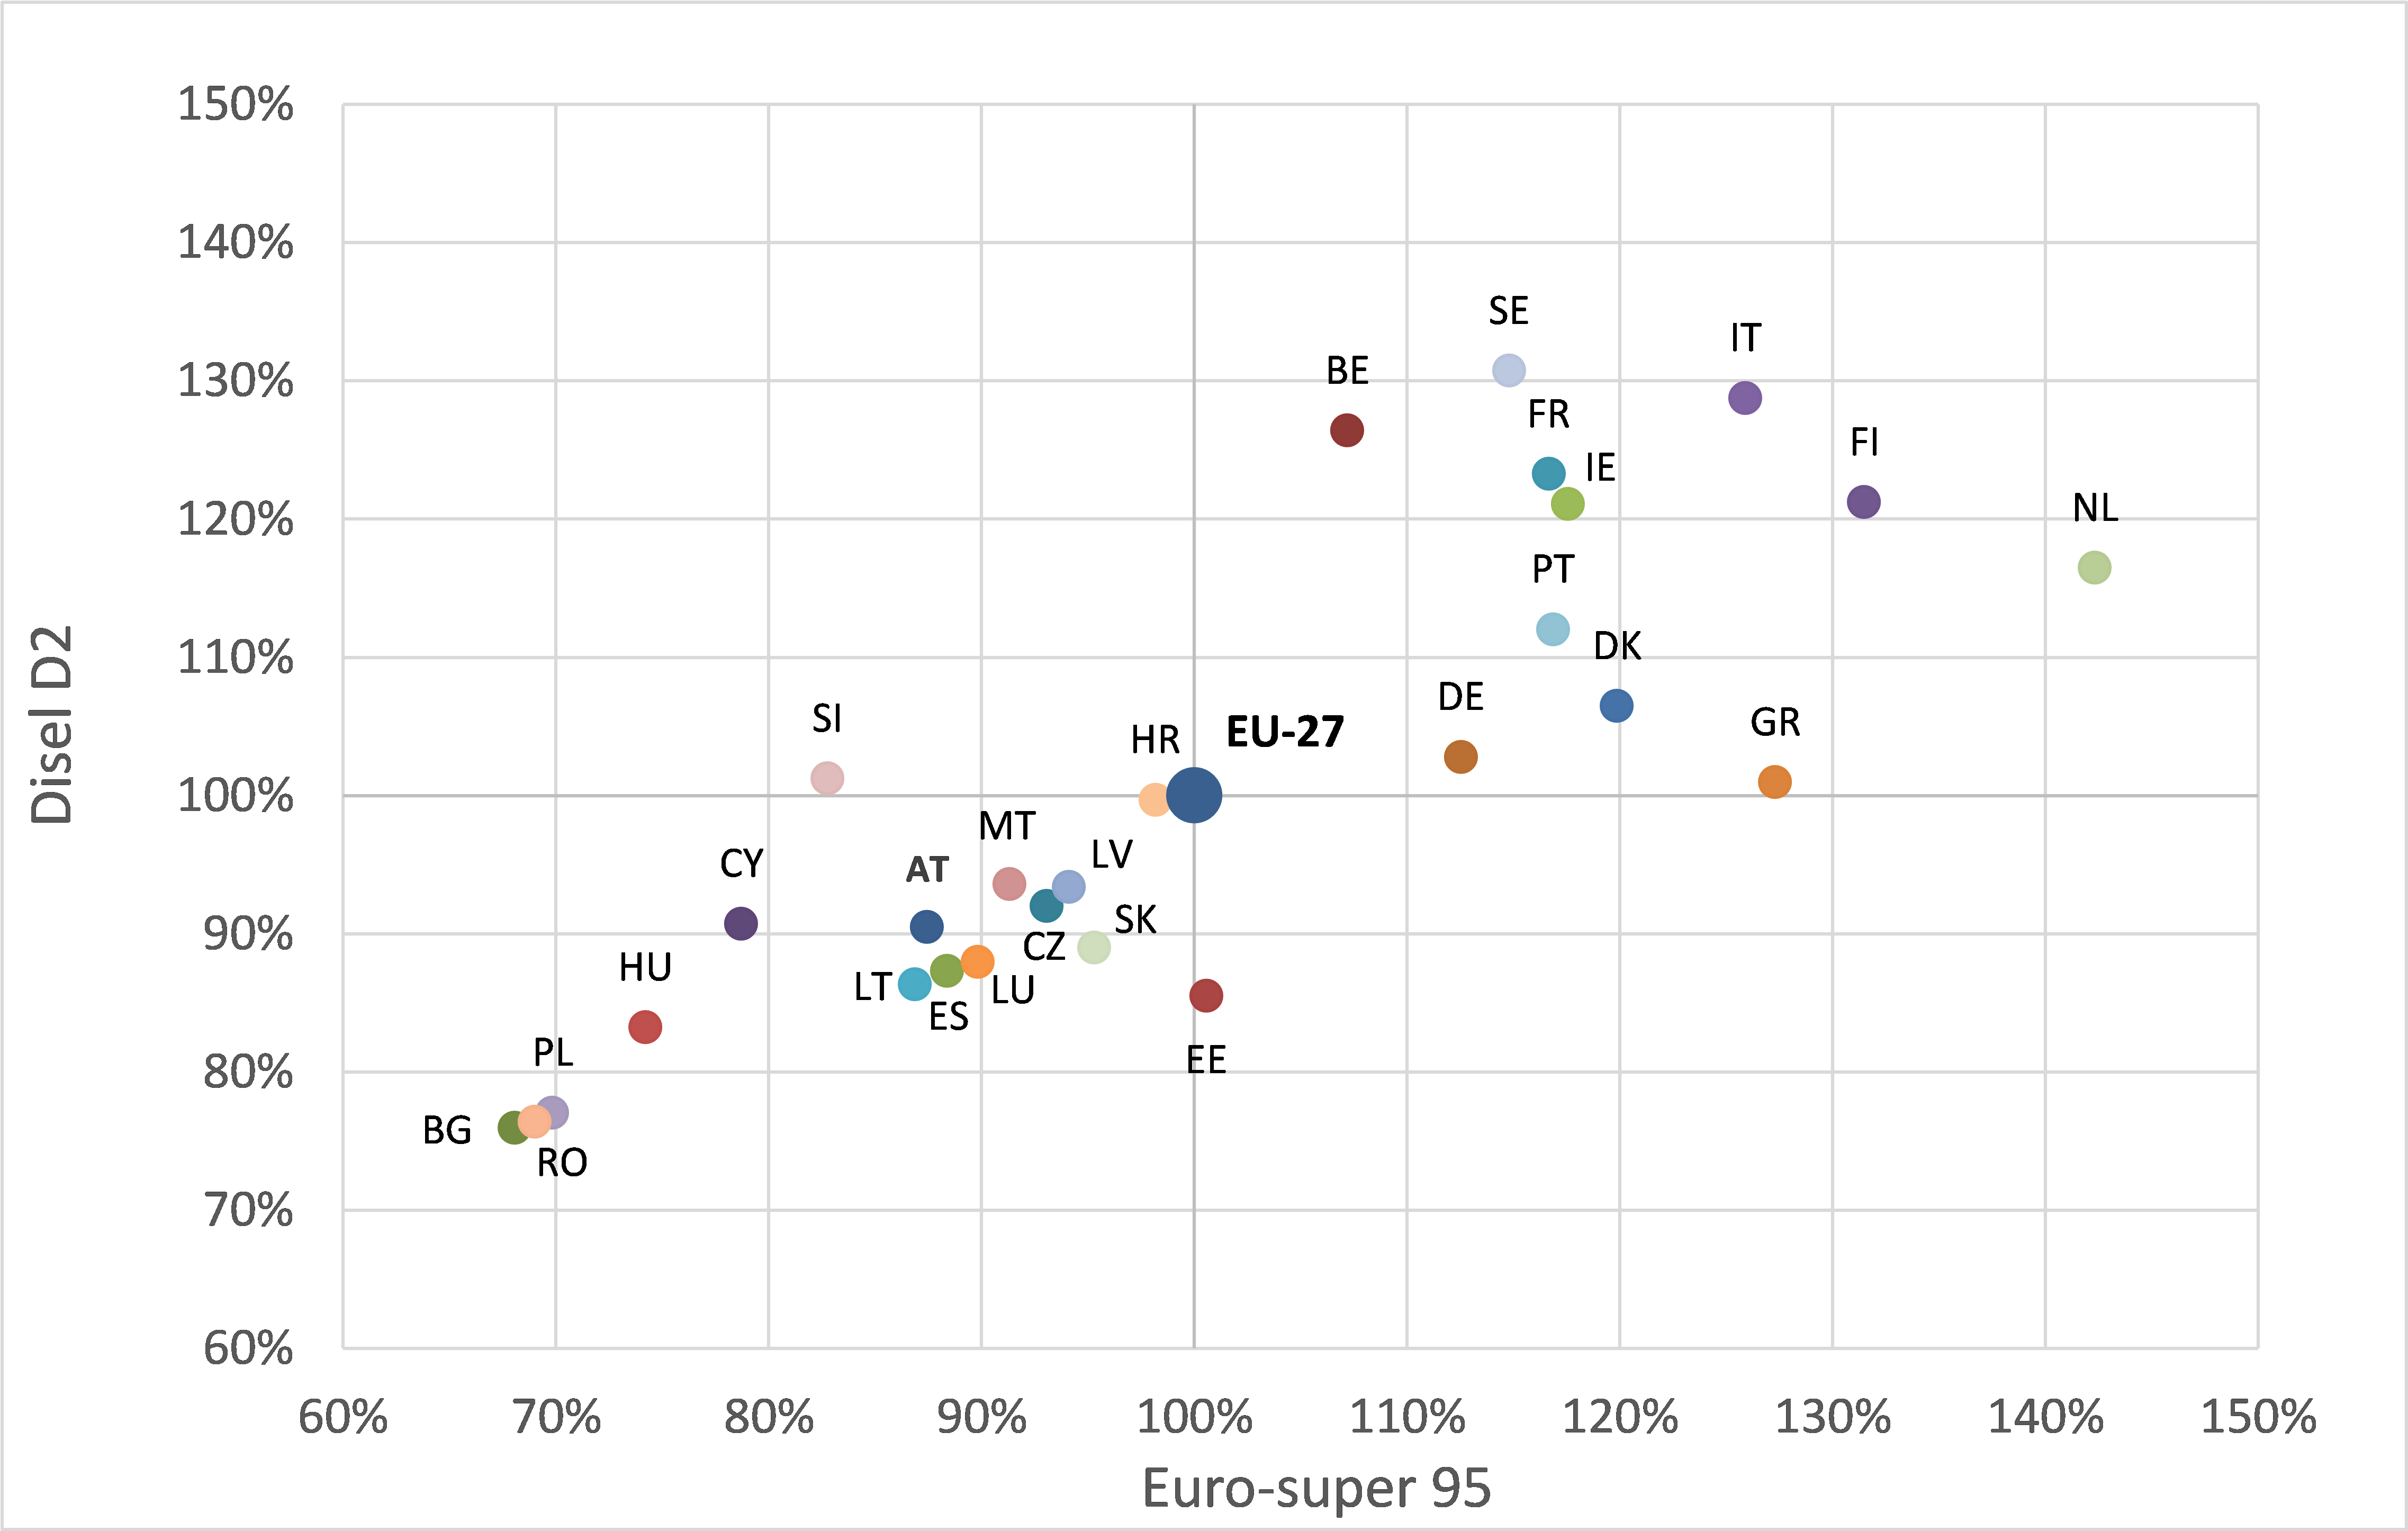
During the period from 2012 to 2022, taxes on energy sources in Slovenia fluctuated, generally decreasing except for electricity for industrial consumers, where they increased due to levies. Between 2020 and 2022, temporary measures were introduced to reduce taxes on certain energy sources due to the COVID-19 pandemic and the war in Ukraine. Compared to the EU-27, the taxation of electricity and natural gas for households in Slovenia was lower, while it was higher for industrial consumers; diesel fuel taxation was higher, while gasoline taxation was lower.
Charts
MECE, SORS (2023)
| 2012-2022[%] | 2012-2019[%] | 2021-2022[%] | |
|---|---|---|---|
| electricity - households | -4.32 | 33.35 | -26.08 |
| electricity - industry | 14.59 | 45.60 | -17.59 |
| Diesel D2 - transport | -11.85 | -0.64 | -7.62 |
| fuel oil - heating | -7.65 | 10.51 | -13.89 |
| natural gas - industry | -24.90 | 10.45 | -31.68 |
| Petrol NMB 95 - transport | -29.39 | -10.06 | -4.38 |
| natural gas - households | -20.65 | -15.14 | -2.36 |
MECE, SORS (2023)
| electricity - industry[EUR/kWh] | electricity - households[EUR/kWh] | |
|---|---|---|
| 2012 | 0.01 | 0.03 |
| 2013 | 0.01 | 0.04 |
| 2014 | 0.01 | 0.05 |
| 2015 | 0.01 | 0.05 |
| 2016 | 0.01 | 0.05 |
| 2017 | 0.01 | 0.05 |
| 2018 | 0.01 | 0.05 |
| 2019 | 0.01 | 0.05 |
| 2020 | 0.01 | 0.04 |
| 2021 | 0.01 | 0.05 |
| 2022 | 0.01 | 0.03 |
SORS (2023)
| natural gas - industry[EUR/GJ] | natural gas - households[EUR/GJ] | |
|---|---|---|
| 2012 | 1.24 | 5.02 |
| 2013 | 1.31 | 4.54 |
| 2014 | 1.37 | 4.58 |
| 2015 | 1.34 | 4.73 |
| 2016 | 1.35 | 4.55 |
| 2017 | 1.34 | 4.33 |
| 2018 | 1.17 | 4.31 |
| 2019 | 1.37 | 4.26 |
| 2020 | 1.28 | 4.22 |
| 2021 | 1.36 | 4.08 |
| 2022 | 0.93 | 3.98 |
MECE (2023)
| Diesel D2[EUR/l] | Euro-super 95[EUR/l] | Fuel oil - heating[EUR/l] | |
|---|---|---|---|
| 2012 | 0.62 | 0.77 | 0.32 |
| 2013 | 0.67 | 0.81 | 0.35 |
| 2014 | 0.69 | 0.81 | 0.39 |
| 2015 | 0.67 | 0.77 | 0.39 |
| 2016 | 0.65 | 0.75 | 0.36 |
| 2017 | 0.67 | 0.75 | 0.35 |
| 2018 | 0.65 | 0.73 | 0.36 |
| 2019 | 0.62 | 0.69 | 0.36 |
| 2020 | 0.58 | 0.61 | 0.33 |
| 2021 | 0.60 | 0.57 | 0.35 |
| 2022 | 0.55 | 0.55 | 0.30 |
SORS, 2017
| Electricity: households - retail price [%] | Electricity: households - price before taxes [%] | Electricity: households - taxes (with VAT)[%] | Natural gas: households: retail price[%] | Natural gas: households: price before taxes[%] | Natural gas: households: taxes (with VAT)[%] | Diesel D2: transport - retail price[%] | Diesel D2: transport - price before taxes[%] | Diesel D2: transport - taxes (with VAT)[%] | Petrol NMB 95: transport - retail price[%] | Petrol NMB 95: transport - price before taxes[%] | Petrol NMB 95: transport - taxes (with VAT)[%] | Fuel oil EL - retail price[%] | Fuel oil EL - price before taxes[%] | Fuel oil EL - taxes (with VAT)[%] | |
|---|---|---|---|---|---|---|---|---|---|---|---|---|---|---|---|
| 2012-2022 | 86.86 | -44.59 | 6.94 | 47.96 | -39.03 | -8.99 | 122.22 | -11.35 | 19.97 | 94.44 | -28.94 | 9.35 | -32.35 | 1.16 | 36.47 |
| 2012-2019 | 198.08 | 0 | 15.98 | 78.75 | 2.23 | -24.61 | 261.11 | 3.69 | -8.08 | 211.11 | -5.91 | -5.69 | -4.41 | 83.72 | 1.18 |
| 2021-2022 | -36.42 | -44.59 | -9.80 | -17.23 | -40.36 | 21.85 | -38.46 | -13.40 | 28.56 | -37.50 | -4.24 | 22.27 | -29.23 | -44.94 | 32.57 |
| 2014 - 2015 | -3.48 | -3.68 | -3.35 | 4.09 | 30.80 | -6.65 | 3.36 | 9.97 | -4.72 | 2.60 | 6.72 | -4.57 | 33.38 | 49.19 | 22.71 |
MECE, SORS (2023)
| 2012 [%] | 2019 [%] | 2022 [%] | |
|---|---|---|---|
| Euro-super 95 | 0.09 | 0.15 | 0.06 |
| Diesel D2 | 0.08 | 0.15 | 0.06 |
| Fuel oul - heating | 0.23 | 0.31 | 0.24 |
| Natural gas: households | 0.22 | 0.30 | 0.22 |
| Electricity: households | 0.46 | 0.55 | 0.41 |
| Natural gas: industry | 0.52 | 0.60 | 0.45 |
| Electricity: industry | 0.32 | 0.41 | 0.28 |
EUROSTAT (2023)
Negative values resulting from tax breaks temporarily introduced by countries in 2022 are not shown in the graph.
| industry[%] | households[%] | |
|---|---|---|
| EU-27 | 100 | 100 |
| BE | 106.28 | 103.38 |
| BG | 149.33 | 140.19 |
| CZ | -149.78 | 35.12 |
| DK | 82.60 | 78.87 |
| DE | 139.10 | 415.40 |
| EE | 160 | 219.15 |
| IE | 97.58 | 96.71 |
| EL | 61.43 | -72.68 |
| ES | -161.79 | -232.86 |
| FR | 98.39 | 109.39 |
| HR | 48.88 | 86.76 |
| IT | 72.56 | 56.34 |
| CY | 117.76 | 89.48 |
| LV | 218.83 | 149.67 |
| LT | 84.75 | 98.78 |
| LU | 98.12 | 67.04 |
| HU | 33.18 | 64.79 |
| MT | 86.73 | 38.87 |
| NL | 14.71 | 14.27 |
| AT | 109.42 | -337.93 |
| PL | 83.59 | 89.11 |
| PT | 113.90 | 103.10 |
| RO | 2.87 | 62.44 |
| SI | 133.99 | 36.81 |
| SK | 81.97 | 76.43 |
| FI | 115.78 | 90.14 |
| SE | 40.27 | 113.52 |
EUROSTAT (2023)
Negative values resulting from tax breaks temporarily introduced by countries in 2022 are not shown in the graph.
| industry[%] | households[%] | |
|---|---|---|
| EU-27 | 100 | 100 |
| BE | 104.64 | 106.48 |
| BG | 46.42 | 61.99 |
| CZ | 26.89 | 19.35 |
| DK | 91.36 | 75.29 |
| DE | 241.10 | 175.51 |
| EE | 99.34 | 109.10 |
| IE | 145.32 | 107.85 |
| EL | 62.01 | 79.73 |
| ES | 44.76 | 31.41 |
| FR | 111.63 | 138.18 |
| HR | 101.05 | 111.06 |
| IT | 46.30 | 23.70 |
| LV | 37.20 | 76.45 |
| LT | 118.53 | 81.68 |
| LU | 131.40 | 80.88 |
| HU | 57.89 | -64.18 |
| NL | 162.73 | 31.15 |
| AT | 151.79 | 286.10 |
| PL | 108.24 | 113.72 |
| PT | 7.73 | 2.83 |
| RO | 112.26 | 126.43 |
| SI | 117.78 | 64.86 |
| SK | 95.82 | 85.34 |
| SE | 282.51 | 40.03 |
Oil bulletin (2023)
| NMB[%] | D2[%] | |
|---|---|---|
| AT | 87.44 | 90.48 |
| BE | 107.19 | 126.40 |
| BG | 68.06 | 75.94 |
| CY | 78.71 | 90.72 |
| CZ | 93.08 | 91.99 |
| DE | 112.52 | 102.80 |
| DK | 119.86 | 106.47 |
| EE | 100.55 | 85.53 |
| ES | 88.38 | 87.30 |
| FI | 131.48 | 121.23 |
| FR | 116.65 | 123.26 |
| GR | 127.30 | 100.95 |
| HR | 98.17 | 99.68 |
| HU | 74.21 | 83.23 |
| IE | 117.56 | 121.10 |
| IT | 125.89 | 128.75 |
| LT | 86.87 | 86.32 |
| LU | 89.83 | 87.95 |
| LV | 94.11 | 93.39 |
| MT | 91.32 | 93.60 |
| NL | 142.31 | 116.48 |
| PL | 69.83 | 77.04 |
| PT | 116.85 | 112.02 |
| RO | 68.99 | 76.41 |
| SE | 114.80 | 130.72 |
| SI | 82.76 | 101.22 |
| SK | 95.28 | 89.01 |
| EU-27 | 100 | 100 |
Goals
Methodology
- Agencija za energijo (2022), Poročilo o stanju na področju energetike v Sloveniji v letu 2022: https://www.agen-rs.si/documents/10926/38704/AZE_Poro%C4%8Dilo_o_stanju_energetike_v_Sloveniji_2022-final3/a85b584b-ca2b-481f-bb84-a396bc4e2dba
- Celoviti nacionalni energetski in podnebni načrt Republike Slovenija (2020): https://www.energetika-portal.si/fileadmin/dokumenti/publikacije/nepn/dokumenti/nepn_5.0_final_feb-2020.pdf
- Dolgoročna podnebna strategija Slovenije do leta 2050 (ReDPS50): http://www.pisrs.si/Pis.web/pregledPredpisa?id=RESO131
- Evropska komisija (2023), Oil bulletin: https://energy.ec.europa.eu/data-and-analysis/weekly-oil-bulletin_en
- Finančna uprava (2023), Trošarine (ZTro-1): https://www.fu.gov.si/davki_in_druge_dajatve/podrocja/trosarine_ztro_1/#c4630
- Intercontinental exchange (2023), Podatki o preteklih cenah emisijskih kuponov: https://www.ice.com/products/197/EUA-Futures/data
- Nacionalni program varstva okolja za obdobje 2020–2030 (ReNPVO20–30): http://www.pisrs.si/Pis.web/pregledPredpisa?id=ODLO1985
- SURS (2022), Indeksna števila in deflacioniranje: https://www.stat.si/statweb/File/DocSysFile/10569/Splosno_MP_Indeksna_stevila.pdf


