[EN21] Energy taxes
[EN21] Energy taxes

Definition
Charts
Figure EN21-1: Missing title
Sources:
Statistical Office of the Republic of Slovenia, 2007
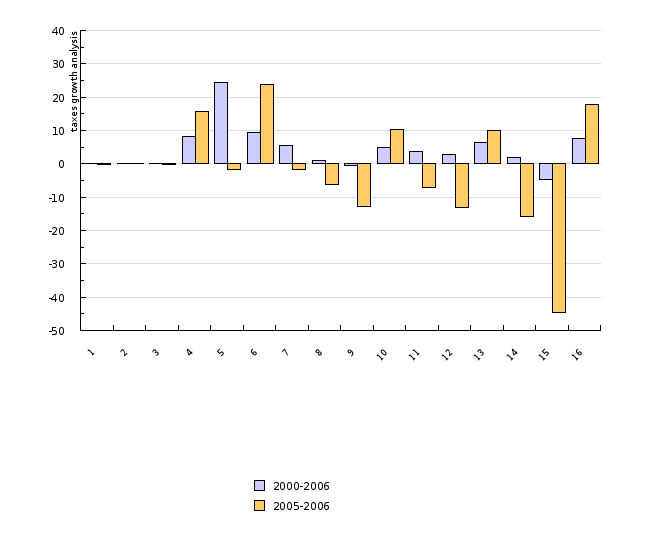
| electricity - industry | natural gas - industry | electricity - households | natural gas - households | diesel D2 - traffic | petrol NMB 95 - traffic | fuel oil - heating | ||
|---|---|---|---|---|---|---|---|---|
| 1995-2006 | % | -100 | 243.6 | 111.3 | 785.3 | 78.7 | 95.9 | 392.9 |
| 2000-2006 | % | 0 | 36.9 | 0.6 | 60.1 | 28.7 | 24.4 | 12.7 |
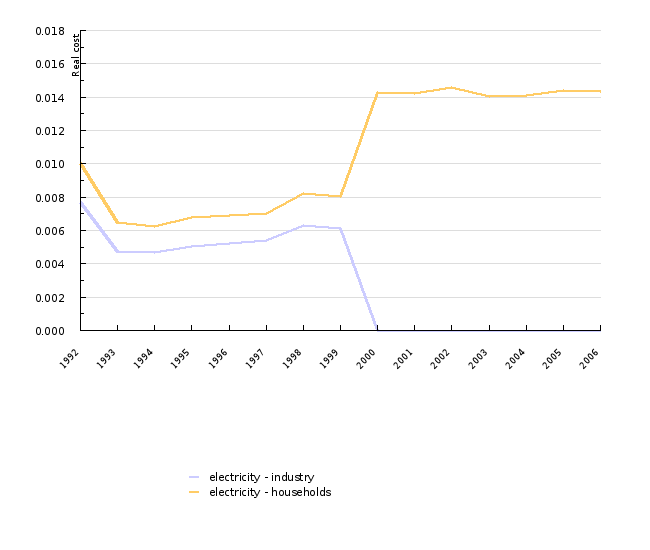
Figure EN21-2: Missing title
Sources:
Statistical Office of the Republic of Slovenia, 2007
| 1992 | 1993 | 1994 | 1995 | 1996 | 1997 | 1998 | 1999 | 2000 | 2001 | ||
|---|---|---|---|---|---|---|---|---|---|---|---|
| electricity - industry | EUR/kWh | 0 | 0 | 0 | 0 | 0 | 0 | 0 | 0 | 0 | 0 |
| electricity - households | EUR/kWh | 0 | 0 | 0 | 0 | 0 | 0 | 0 | 0 | 0 | 0 |
| 2002 | 2003 | 2004 | 2005 | 2006 | |||||||
| electricity - industry | EUR/kWh | 0 | 0 | 0 | 0 | 0 | |||||
| electricity - households | EUR/kWh | 0 | 0 | 0 | 0 | 0 |
Figure EN21-3: Missing title
Sources:
Statistical Office of the Republic of Slovenia, 2007
| 1995 | 1996 | 1997 | 1998 | 1999 | 2000 | 2001 | 2002 | 2003 | 2004 | ||
|---|---|---|---|---|---|---|---|---|---|---|---|
| natural gas - industry | EUR/GJ | 0.2 | 0.2 | 0.4 | 0.4 | 0.7 | 0.5 | 0.6 | 0.7 | 0.7 | 0.7 |
| natural gas - households | EUR/GJ | 0.3 | 0.3 | 0.4 | 0.5 | 0.7 | 1.5 | 2.1 | 2.1 | 2.1 | 2 |
| 2005 | 2006 | ||||||||||
| natural gas - industry | EUR/GJ | 0.7 | 0.7 | ||||||||
| natural gas - households | EUR/GJ | 2.1 | 2.4 |
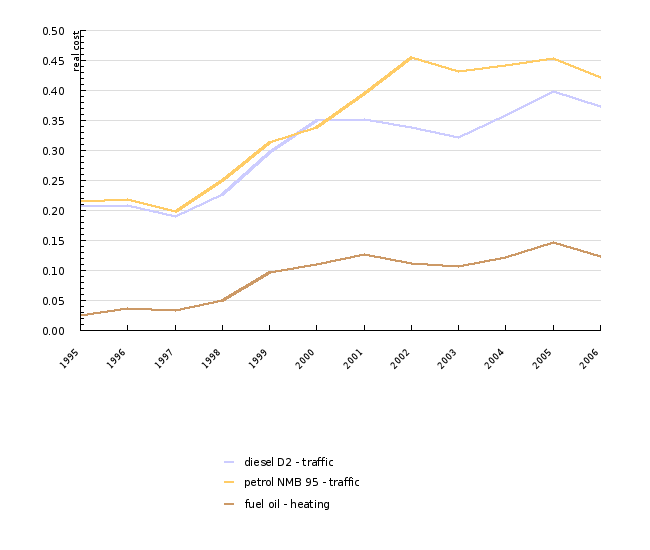
Figure EN21-4: Missing title
Sources:
Statistical Office of the Republic of Slovenia, 2007; PETROL, 2007
| 1995 | 1996 | 1997 | 1998 | 1999 | 2000 | 2001 | 2002 | 2003 | 2004 | ||
|---|---|---|---|---|---|---|---|---|---|---|---|
| diesel D2 - traffic | EUR/l | 0.2 | 0.2 | 0.2 | 0.2 | 0.3 | 0.3 | 0.4 | 0.3 | 0.3 | 0.4 |
| petrol NMB 95 - traffic | EUR/l | 0.2 | 0.2 | 0.2 | 0.2 | 0.3 | 0.3 | 0.4 | 0.5 | 0.4 | 0.4 |
| fuel oil - heating | EUR/l | 0 | 0 | 0 | 0.1 | 0.1 | 0.1 | 0.1 | 0.1 | 0.1 | 0.1 |
| 2005 | 2006 | ||||||||||
| diesel D2 - traffic | EUR/l | 0.4 | 0.4 | ||||||||
| petrol NMB 95 - traffic | EUR/l | 0.5 | 0.4 | ||||||||
| fuel oil - heating | EUR/l | 0.1 | 0.1 |
Figure EN21-5: Missing title
Sources:
Statistical Office of the Republic of Slovenia, 2007
Figure EN21-6: Missing title
Sources:
Statistical Office of the Republic of Slovenia, 2007; PETROL, 2007; Statistical Office of the European Communities, 2007
| 1995 | 2000 | 2006 | EU-15 (povprečje 2000-2006) | EU-15 2006 | ||
|---|---|---|---|---|---|---|
| Petrol NMB 95 - traffic | % | 49.5 | 62.4 | 55.8 | 69.1 | 65.6 |
| Diesel D2 - traffic | % | 51.8 | 60.1 | 49.8 | 50.2 | 55.5 |
| fuel oil - heating | % | 11.9 | 33.8 | 25.8 | 32.2 | 29.2 |
| natural gas - householdings | % | 4.8 | 23.3 | 22.8 | 25.9 | 23.1 |
| electricity - householdings | % | 9.1 | 16 | 16.7 | 23.4 | 24 |
| natural gas - industry | % | 4.8 | 8.3 | 8.3 | 7.2 | 6.5 |
| electricity - industry | % | 9.1 | 0 | 0 | 10.1 | 11.5 |
Figure EN21-7: Missing title
Sources:
Statistical Office of the European Communities, 2007
Figure EN21-8: Missing title
Sources:
Statistical Office of the European Communities, 2007
Figure EN21-9: Missing title
Sources:
Oil Buletin (18.12.2006)


