[PG06] Household expenditure

Key message

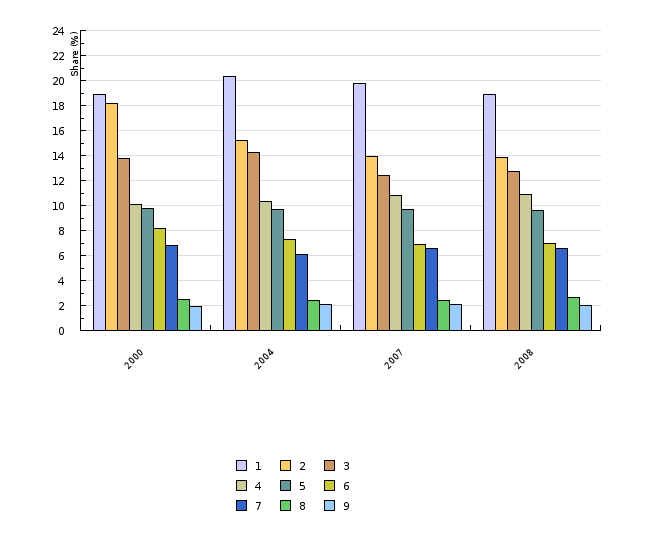
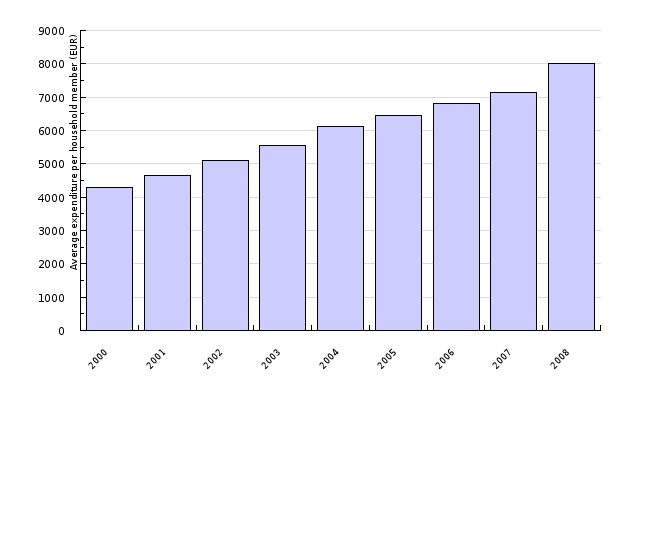
Consumption expenditure is increasing in line with the growth of income. On average, a household member in Slovenia spends the most on transport and communications (20%) and food and non-alcoholic beverages (14%). The average total expenditure per household member in Slovenia in 2009 amounted to EUR 8,023, which was 87% more than in 2000.
Definition
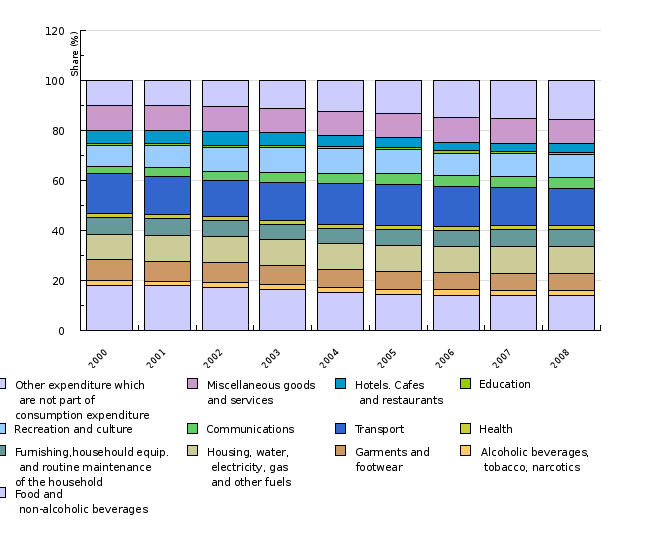
The indicator shows the changes in the structure of household consumption expenditure with regard to the average annual budget for an individual group of goods or services, thus enabling the tracking of the changes in consumption patterns.
Charts
Statistical Office of the Republic of Slovenia, SI-STAT Data Portal (Household Budget Survey), 2009
Legend:
1 - Transport and comunications,
2 - Food and non-alcoholic drinks,
3 - Recreation, culture, restaurants and hotels,
4 - Housing, water, electricity, gas and other fuels,
5 - Other products and services,
6 - Garments and footwear,
7 - Furnishing, househould equipment and routine maintenance of the household,
8 - Health and education,
9 - Alcohol, tobacco and narcotics
| 2000 | 2004 | 2007 | 2008 | ||
|---|---|---|---|---|---|
| 1 | (%) | 18.9 | 20.4 | 19.8 | 18.9 |
| 2 | (%) | 18.2 | 15.2 | 13.9 | 13.8 |
| 3 | (%) | 13.7 | 14.3 | 12.4 | 12.8 |
| 4 | (%) | 10.1 | 10.3 | 10.8 | 10.9 |
| 5 | (%) | 9.8 | 9.7 | 9.7 | 9.6 |
| 6 | (%) | 8.1 | 7.3 | 6.9 | 7 |
| 7 | (%) | 6.8 | 6.1 | 6.6 | 6.6 |
| 8 | (%) | 2.5 | 2.4 | 2.4 | 2.7 |
| 9 | (%) | 1.9 | 2.1 | 2.1 | 2 |
Statistical Office of the Republic of Slovenia, SI-STAT Data Portal (Household Budget Survey), 2009
| 2000 | 2001 | 2002 | 2003 | 2004 | 2005 | 2006 | 2007 | 2008 | ||
|---|---|---|---|---|---|---|---|---|---|---|
| Food and non-alcoholic beverages |
(%) | 18.17 | 17.82 | 17.37 | 16.35 | 15.17 | 14.46 | 14.09 | 13.94 | 13.81 |
| Alcoholic beverages, tobacco, narcotics |
(%) | 1.91 | 1.83 | 1.91 | 2.02 | 2.11 | 2.11 | 2.16 | 2.11 | 2.01 |
| Garments and footwear |
(%) | 8.13 | 7.99 | 7.93 | 7.69 | 7.32 | 6.97 | 6.78 | 6.87 | 6.96 |
| Housing, water, electricity, gas and other fuels |
(%) | 10.05 | 10.51 | 10.43 | 10.38 | 10.31 | 10.55 | 10.58 | 10.83 | 10.92 |
| Furnishing,househould equip. and routine maintenance of the household |
(%) | 6.83 | 6.71 | 6.35 | 6.07 | 6.06 | 6.32 | 6.44 | 6.6 | 6.58 |
| Health | (%) | 1.65 | 1.65 | 1.66 | 1.58 | 1.55 | 1.48 | 1.51 | 1.62 | 1.87 |
| Transport | (%) | 16.05 | 15.21 | 14.2 | 15.17 | 16.21 | 16.64 | 15.92 | 15.3 | 14.52 |
| Communications | (%) | 2.85 | 3.42 | 3.88 | 4.08 | 4.14 | 4.34 | 4.44 | 4.46 | 4.37 |
| Recreation and culture | (%) | 8.51 | 8.89 | 9.51 | 9.79 | 9.74 | 9.46 | 9.06 | 8.95 | 9.18 |
| Education | (%) | 0.82 | 0.87 | 0.9 | 0.84 | 0.88 | 0.91 | 0.92 | 0.81 | 0.81 |
| Hotels. Cafes and restaurants |
(%) | 5.22 | 5.2 | 5.43 | 5.24 | 4.51 | 4.06 | 3.48 | 3.45 | 3.58 |
| Miscellaneous goods and services |
(%) | 9.75 | 9.85 | 9.94 | 9.78 | 9.68 | 9.59 | 9.66 | 9.67 | 9.63 |
| Other expenditure which are not part of consumption expenditure |
(%) | 10.07 | 10.04 | 10.5 | 11.02 | 12.3 | 13.12 | 14.95 | 15.41 | 15.76 |
Statistical Office of the Republic of Slovenia, SSI-STAT Data Portal (Household Budget Survey), 2009
| 2000 | 2001 | 2002 | 2003 | 2004 | 2005 | 2006 | 2007 | 2008 | ||
|---|---|---|---|---|---|---|---|---|---|---|
| Consumption | (EUR) | 4295 | 4653 | 5090 | 5536 | 6118 | 6435 | 6805 | 7142 | 8023 |
Goals
· To improve environmental and energy attributes of products sold in the European Union;
· to adopt a life-cycle approach in production;
· to introduce green tariffs;
· to provide better information to the consumers, and;
· to encourage the Member States to introduce green public procurement.
Comment
With the growth of income, consumption expenditure has also increased. Owing to abundance, consumption by the majority of the European population has been higher than required for basic needs. Consumption of some products and services has been even higher than their usefulness, and in many cases even higher than environmental sustainability allows. Household consumption patterns are shaped by an array of interdependent economic, social, cultural and political driving forces. The following are among the most important in Europe: growing income and well-being, globalisation of the economy through opening of markets, increasing individualism, new technologies, targeted marketing and advertising, smaller households, etc.
Households represent an important part of the production-consumption chain, as household consumers play an important role in their daily selection of goods and services. Although the environmental impact of each household is relatively small compared to that of large industrial plants, numerous households are major contributors to environmental problems. As individuals or households, we affect the environment through the choices we make about where and how to live, where to work, how to spend our leisure time, and which means of transport to use. Most often, our choices are made with certain boundaries conditioned by historical developments and past policy decisions, for example, urban planning, transport infrastructure and available housing. However, even within the existing framework, it is possible to find a more balanced way of life.
According to the data provided by the Statistical Office of the Republic of Slovenia, a household member in Slovenia spends, on average, most funds on transport and communication (19%), somewhat less on food and soft drinks (14%), even less on recreation, culture, education, restaurants and hotels (13%), and the least on dwelling, electricity and other fuels (11%). While the expenditure of household members on food and drink has decreased by 4.4% and on clothing and footwear by 1.2%, the expenditure on dwellings has increased by 0.9%, on communication by 1.5% and on recreation and culture by 0.7%. In 2009, the total average expenditure per household member in Slovenia amounted to EUR 8,023, which was 87% more than in 2000, when consumption expenditure amounted to 4,295 EUR.
In the EU-25, expenditures on transport and communication, dwellings (including utility payments), recreation, health, and education is growing the fastest. In the EU-15, recreation presents the second largest area of household consumption. Consumption patterns of the EU-10 are moving closer to those of the EU-15, showing that lifestyles are changing and, in general, incomes are rising. Similar to Slovenia, the EU-25 has also noted a decrease in household expenditures on food, despite the rising incomes. Between 1995 and 2005, the share dropped from 14.4% to 12.5%.
In the last fifty years, people have used more goods and services than the entire planet's population had ever before. Our enormously productive economy has led to consumption becoming our way of life and shopping a ritual that provides relief from our personal problems; shopping centres have become places to meet and spend time with friends and acquaintances. With the development of excessive consumption, we have contributed to the existing situation in which the economy has been producing increasing quantities of various products. The increasing trend in purchasing power and the growth of funds earmarked for advertising have created a never-ending circle of shopping and consumption. Consequently, the distinction between the interdependent phenomena of consumption and production is becoming increasingly blurred.
Methodology
Data for Slovenia:
Objectives summarized by: Communication from the Commission to the Council and the European Parliament on the Integrated Product Policy (The Communication on the Integrated Product Policy), 2003
Source database or source: SI-STAT Database (Household Budget Survey).
Data administrator: Statistical Office of the Republic of Slovenia
Data acquisition date for this indicator: 15 August 2009
Methodology and frequency of data collection for the indicator: The Statistical Office of the Republic of Slovenia collects data on consumption expenditure through a questionnaire entitled 'Household Budget Survey'. Data for the period of three years has been calculated to the middle year and taken into account in the interpretation of the results for the reference year. The data is published on the SI-STAT Data Portal, under the Chapter: Demography and Social Statistics, Level of Living, Household Budget Survey, Average annual allocated assets of households (consumption structure per household member and average consumption per household member (EUR)).
Consumption expenditures (the concept of consumption expenditures) are classified according to the COICOP – Classification of Individual Consumption by Purpose.
Data processing methodology: The data for the Structure of Household Consumption Expenditure is provided for the first, the last and the middle year available.
Information concerning data quality:
- advantages and disadvantages of the indicator:/
- relevance, accuracy, robustness, uncertainty: 2
Reliability of the indicator (archival data): 2
Uncertainty of the indicator (scenarios/projections): /
- Overall assessment (1 = no major comments, 3 = data to be considered with reservation): 2
Relevance: 2
Accuracy: 1
Completeness over time: 1
Completeness over space: 1
Other sources and literature:
Comparison for Europe and a wider area is derived from:
• EEA Report: Europe's Environment, The fourth assessment – sustainable consumption and production
• EEA Report, No. 11/2005; Household consumption and the environment 02 Jan 2006
• Internal Material of the Ministry of the Environment and Spatial Planning


