[PO38] GHG emissions in industry
[PO38] GHG emissions in industry

Key message

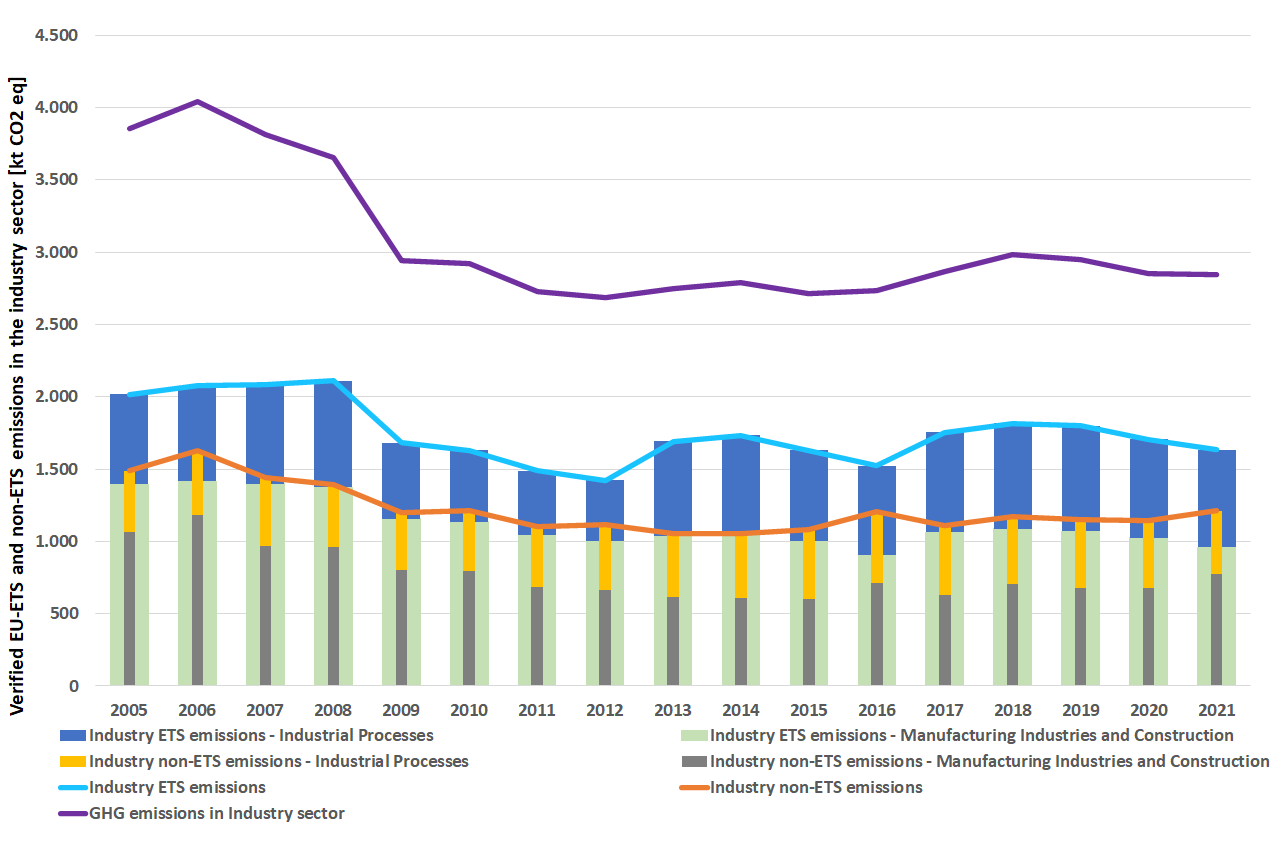
GHG emissions in industry decreased by 7,1% in 2023 compared to the previous year. Since 2019, a trend of decreasing GHG emissions has been observed in this sector, mainly due to the reduction of GHG emissions in the ETS subsector of the industry sector.
GHG emissions in the ETS subsector of industry sector decreased for the fifth year in a row and were 12,5% lower than the previous year. GHG emissions in the non-ETS subsector of the industry sector increased only slightly in 2021 compared to the previous year. In 2023, the share of emissions from the ETS subsector was 55,1% of all emissions in industry sector, and the share of non-ETS emissions was 44,9%.
Charts
Figure PO38-1: EU-ETS and non-ETS emissions in the industry sector divided into manufacturing activities and industrial processes in the period 2005−2023
Sources:
Jožef Stefan Institute - Energy Efficiency Centre
| Industry ETS emissions[kt CO2 ekv] | Industry non-ETS emissions[kt CO2 ekv] | Industry ETS emissions - Industrial Processes[kt CO2 ekv] | Industry ETS emissions - Manufacturing Industries and Construction[kt CO2 ekv] | Industry non-ETS emissions - Industrial Processes[kt CO2 ekv] | Industry non-ETS emissions - Manufacturing Industries and Construction[kt CO2 ekv] | GHG emissions in industry sector[kt CO2 ekv] | |
|---|---|---|---|---|---|---|---|
| 2005 | 2016.94 | 1506.44 | 621.68 | 1395.26 | 435.86 | 1070.58 | 3860.68 |
| 2006 | 2075.17 | 1641.14 | 658.92 | 1416.25 | 455.29 | 1185.86 | 4041.18 |
| 2007 | 2083.40 | 1452.11 | 685.54 | 1397.86 | 485.77 | 966.34 | 3813.22 |
| 2008 | 2109.92 | 1397.93 | 736.21 | 1373.72 | 435.22 | 962.71 | 3658.95 |
| 2009 | 1680.88 | 1203.60 | 524.55 | 1156.34 | 401.49 | 802.11 | 2944.34 |
| 2010 | 1628.96 | 1218.76 | 491.88 | 1137.08 | 422.06 | 796.70 | 2920.48 |
| 2011 | 1488.25 | 1106.61 | 444.02 | 1044.23 | 417.13 | 689.49 | 2731.39 |
| 2012 | 1420.98 | 1118.86 | 421.36 | 999.62 | 454.30 | 664.56 | 2688.11 |
| 2013 | 1691.98 | 1058.42 | 653.06 | 1038.92 | 438.01 | 620.42 | 2750.41 |
| 2014 | 1734.79 | 1059.16 | 680.28 | 1054.52 | 448.00 | 611.15 | 2793.95 |
| 2015 | 1631.74 | 1087.93 | 631.71 | 1000.03 | 476.59 | 611.34 | 2719.68 |
| 2016 | 1523.11 | 1213.82 | 618.58 | 904.53 | 496.13 | 717.69 | 2736.93 |
| 2017 | 1753.17 | 1124.42 | 690.30 | 1062.87 | 482.94 | 641.48 | 2877.58 |
| 2018 | 1816.07 | 1206.30 | 728.83 | 1087.24 | 467.39 | 738.91 | 3022.37 |
| 2019 | 1800.77 | 1164.06 | 729.14 | 1071.64 | 481.90 | 682.16 | 2964.84 |
| 2020 | 1704.57 | 1161.95 | 680.95 | 1023.62 | 473.04 | 688.91 | 2866.24 |
| 2021 | 1632.76 | 1236.88 | 673.00 | 959.76 | 454.56 | 782.32 | 2869.99 |
| 2022 | 1589.73 | 1125.66 | 648.89 | 940.84 | 446.11 | 679.55 | 2715.70 |
| 2023 | 1390.86 | 1131.03 | 560.35 | 830.51 | 444.95 | 686.08 | 2522.20 |


