[ZR09] Emissions of acidifying and eutrophying substances
[ZR09] Emissions of acidifying and eutrophying substances

Key message

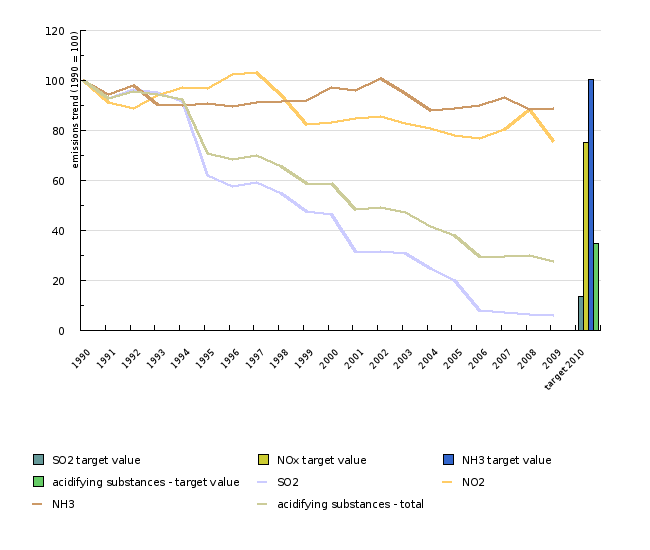
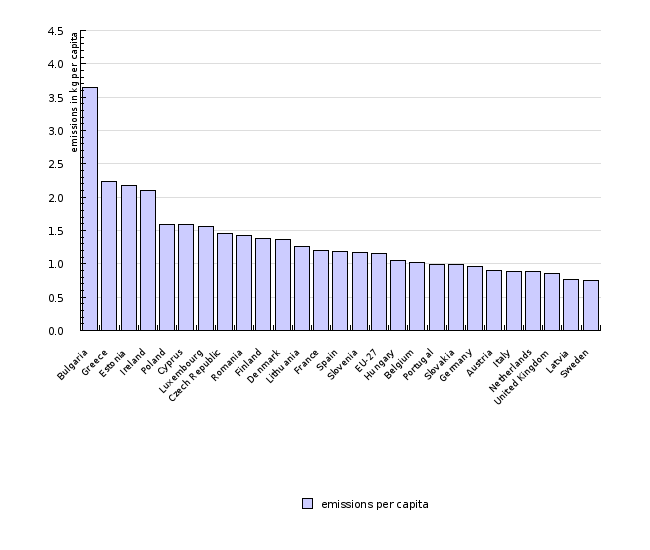
Emissions of gases causing acidification and eutrophication in the period 1990 - 2009 decreased by 72%, primarily due to the reduction of SO2 emissions. Comparison of emissions per capita ranks Slovenia on the 15th place in the EU-27.
Definition
Keywords:
Air pollution, Agriculture, Road transport, Energy production, air emissions, ammonia, air quality, CSI001, acidification, SO2, NOx, NH3, air, pollution
Charts
Figure ZR09-1: Changes in emissions of acidifying and eutrophying substances compared to 1990 state and 2010 targets
Sources:
Airnet, State-owned emissions database, Slovenian Environment Agency, 2011
| 1990 | 1991 | 1992 | 1993 | 1994 | 1995 | 1996 | 1997 | 1998 | 1999 | ||
|---|---|---|---|---|---|---|---|---|---|---|---|
| SO2 | kt acid equivalents | 6.2 | 5.7 | 6 | 5.9 | 5.7 | 3.8 | 3.6 | 3.7 | 3.4 | 3 |
| NO2 | kt acid equivalents | 1.3 | 1.2 | 1.2 | 1.2 | 1.3 | 1.3 | 1.3 | 1.3 | 1.2 | 1.1 |
| NH3 | kt acid equivalents | 1.2 | 1.1 | 1.1 | 1.1 | 1.1 | 1.1 | 1 | 1.1 | 1.1 | 1.1 |
| acidifying substances - total | kt acid equivalents | 8.7 | 8 | 8.3 | 8.2 | 8 | 6.1 | 5.9 | 6.1 | 5.7 | 5.1 |
| SO2 | index (1990 = 100) | 100 | 92.9 | 96.6 | 95.1 | 91.8 | 61.8 | 57.5 | 59.3 | 54.7 | 47.7 |
| NO2 | index (1990 = 100) | 100 | 91.4 | 88.6 | 93.8 | 97.3 | 96.6 | 102.6 | 103.2 | 93.9 | 82.4 |
| NH3 | index (1990 = 100) | 100 | 94.2 | 98 | 90.3 | 90 | 90.7 | 89.5 | 91 | 91.7 | 92 |
| acidifying substances - total | index (1990 = 100) | 100 | 92.8 | 95.6 | 94.2 | 92.4 | 71 | 68.6 | 70.1 | 65.6 | 58.9 |
| SO2 target value | index (1990 = 100) | ||||||||||
| NOx target value | index (1990 = 100) | ||||||||||
| NH3 target value | index (1990 = 100) | ||||||||||
| acidifying substances - target value | index (1990 = 100) | ||||||||||
| 2000 | 2001 | 2002 | 2003 | 2004 | 2005 | 2006 | 2007 | 2008 | 2009 | ||
| SO2 | kt acid equivalents | 2.9 | 2 | 2 | 1.9 | 1.5 | 1.2 | 0.5 | 0.4 | 0.4 | 0.4 |
| NO2 | kt acid equivalents | 1.1 | 1.1 | 1.1 | 1.1 | 1 | 1 | 1 | 1 | 1.2 | 1 |
| NH3 | kt acid equivalents | 1.1 | 1.1 | 1.2 | 1.1 | 1 | 1 | 1.1 | 1.1 | 1 | 1 |
| acidifying substances - total | kt acid equivalents | 5.1 | 4.2 | 4.3 | 4.1 | 3.6 | 3.3 | 2.6 | 2.6 | 2.6 | 2.4 |
| SO2 | index (1990 = 100) | 46.5 | 31.8 | 31.7 | 30.9 | 24.7 | 20.1 | 8.1 | 7 | 6.4 | 5.8 |
| NO2 | index (1990 = 100) | 83.2 | 84.9 | 85.7 | 82.8 | 80.7 | 78.1 | 76.9 | 80.5 | 88.5 | 75.5 |
| NH3 | index (1990 = 100) | 97.3 | 96.1 | 100.8 | 94.6 | 87.9 | 88.7 | 89.8 | 93.4 | 88.5 | 88.9 |
| acidifying substances - total | index (1990 = 100) | 58.9 | 48.4 | 49.1 | 47.3 | 41.7 | 38.1 | 29.5 | 29.7 | 29.9 | 27.5 |
| SO2 target value | index (1990 = 100) | ||||||||||
| NOx target value | index (1990 = 100) | ||||||||||
| NH3 target value | index (1990 = 100) | ||||||||||
| acidifying substances - target value | index (1990 = 100) | ||||||||||
| target 2010 | |||||||||||
| SO2 | kt acid equivalents | ||||||||||
| NO2 | kt acid equivalents | ||||||||||
| NH3 | kt acid equivalents | ||||||||||
| acidifying substances - total | kt acid equivalents | ||||||||||
| SO2 | index (1990 = 100) | ||||||||||
| NO2 | index (1990 = 100) | ||||||||||
| NH3 | index (1990 = 100) | ||||||||||
| acidifying substances - total | index (1990 = 100) | ||||||||||
| SO2 target value | index (1990 = 100) | 13.6 | |||||||||
| NOx target value | index (1990 = 100) | 75.2 | |||||||||
| NH3 target value | index (1990 = 100) | 100.5 | |||||||||
| acidifying substances - target value | index (1990 = 100) | 34.6 |
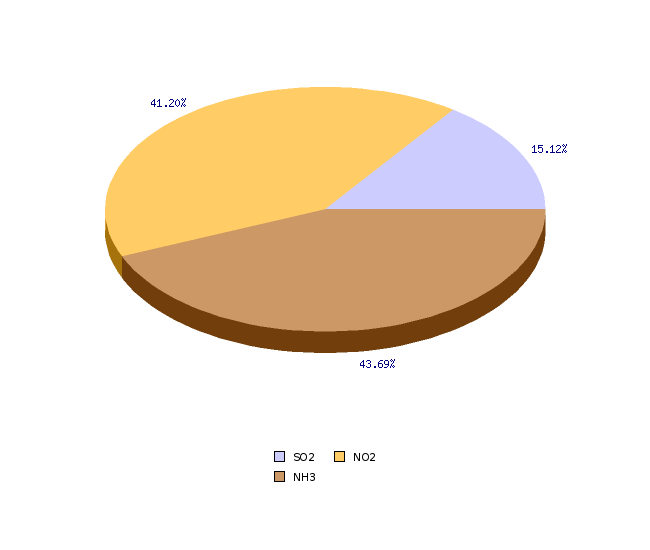
Figure ZR09-2: Prispevek posameznih snovi k skupnim izpustom snovi, ki povzročajo zakisovanje in evtrofikacijo za leto 2009
Sources:
Airnet, Državne evidence izpustov, Agencija RS za okolje, 2011
| 2009 | ||
|---|---|---|
| SO2 | kt acid equivalents | 0.4 |
| NO2 | kt acid equivalents | 1 |
| NH3 | kt acid equivalents | 1 |
| acidifying substances - total | kt acid equivalents | 2.4 |
| SO2 | % | 15.1 |
| NO2 | % | 41.2 |
| NH3 | % | 43.7 |
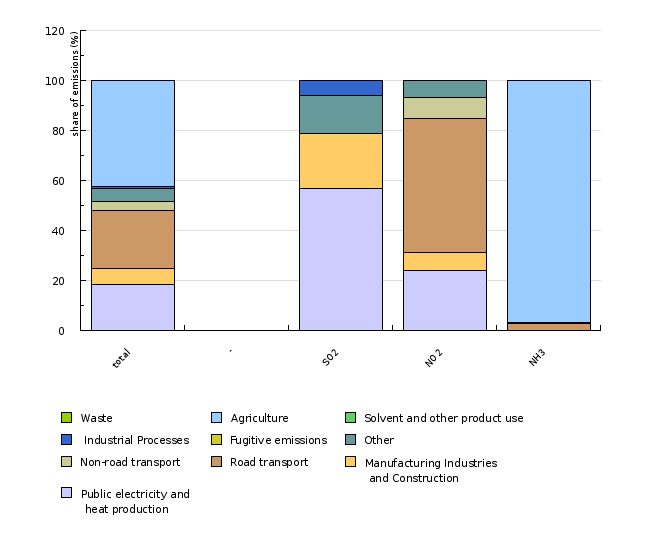
Figure ZR09-3: Missing title
Show data| total | - | SO2 | NO2 | NH3 | ||
|---|---|---|---|---|---|---|
| Public electricity and heat production | kt acid equivalents | 0.44 | 0.2 | 0.24 | 0 | |
| Manufacturing Industries and Construction | kt acid equivalents | 0.15 | 0.08 | 0.07 | 0 | |
| Road transport | kt acid equivalents | 0.56 | 0 | 0.53 | 0.03 | |
| Non-road transport | kt acid equivalents | 0.09 | 0 | 0.09 | 0 | |
| Other | kt acid equivalents | 0.12 | 0.05 | 0.06 | 0 | |
| Fugitive emissions | kt acid equivalents | 0 | 0 | 0 | 0 | |
| Industrial Processes | kt acid equivalents | 0.03 | 0.02 | 0 | 0.01 | |
| Solvent and other product use | kt acid equivalents | 0 | 0 | 0 | 0 | |
| Agriculture | kt acid equivalents | 1.01 | 0 | 0 | 1.01 | |
| Waste | kt acid equivalents | 0 | 0 | 0 | 0 | |
| total | kt acid equivalents | 2.38 | 0.36 | 0.98 | 1.04 | |
| Public electricity and heat production |
% | 18.54 | 56.88 | 24.13 | 0 | |
| Manufacturing Industries and Construction |
% | 6.12 | 21.8 | 6.87 | 0 | |
| Road transport | % | 23.36 | 0.29 | 53.7 | 2.72 | |
| Non-road transport | % | 3.58 | 0.02 | 8.69 | 0 | |
| Other | % | 5.02 | 15.17 | 6.61 | 0 | |
| Fugitive emissions | % | 0 | 0 | 0 | 0 | |
| Industrial Processes | % | 1.15 | 5.84 | 0 | 0.62 | |
| Solvent and other product use | % | 0 | 0 | 0 | 0 | |
| Agriculture | % | 42.23 | 0 | 0 | 96.66 | |
| Waste | % | 0 | 0 | 0 | 0 |
Figure ZR09-4: Emissions of acidifying and eutrophying substances per capita in EU-27 2009
Sources:
Air pollutant emissions data viewer (NEC Directive), EEA, Eurostat, 2011
| Bulgaria | Greece | Estonia | Ireland | Poland | Cyprus | Luxembourg | Czech Republic | Romania | Finland | ||
|---|---|---|---|---|---|---|---|---|---|---|---|
| NOx | kt acid equivalents | 3.58 | 8.16 | 0.63 | 1.96 | 17.82 | 0.42 | 0.41 | 5.5 | 5.38 | 3.32 |
| SO2 | kt acid equivalents | 20.56 | 13.35 | 1.71 | 1.02 | 26.92 | 0.53 | 0.1 | 5.45 | 14.37 | 1.85 |
| NH3 | kt acid equivalents | 3.63 | 3.69 | 0.58 | 6.34 | 16.08 | 0.31 | 0.26 | 4.31 | 11 | 2.16 |
| emissions of acidifying substances | kt acid equivalents | 27.77 | 25.2 | 2.92 | 9.32 | 60.81 | 1.27 | 0.77 | 15.26 | 30.75 | 7.33 |
| country population | number | 7606551 | 11260402 | 1340415 | 4450030 | 38135876 | 796875 | 493500 | 10467542 | 21498616 | 5326314 |
| emissions per capita | kg/capita | 3.65 | 2.24 | 2.18 | 2.1 | 1.59 | 1.59 | 1.56 | 1.46 | 1.43 | 1.38 |
| Denmark | Lithuania | France | Spain | Slovenia | EU-27 | Hungary | Belgium | Portugal | Slovakia | ||
| NOx | kt acid equivalents | 2.87 | 1.41 | 24.28 | 21.01 | 0.98 | 200.74 | 3.62 | 4.64 | 5.17 | 1.86 |
| SO2 | kt acid equivalents | 0.48 | 1.13 | 9.47 | 12.64 | 0.36 | 157.32 | 2.91 | 2.39 | 2.49 | 2 |
| NH3 | kt acid equivalents | 4.2 | 1.67 | 43.75 | 20.83 | 1.04 | 222.51 | 3.99 | 3.93 | 2.88 | 1.47 |
| emissions of acidifying substances | kt acid equivalents | 7.55 | 4.21 | 77.5 | 54.48 | 2.38 | 580.57 | 10.52 | 10.95 | 10.53 | 5.34 |
| country population | number | 5511451 | 3349872 | 64369147 | 45828172 | 2032362 | 499705496 | 10030975 | 10753080 | 10627250 | 5412254 |
| emissions per capita | kg/capita | 1.37 | 1.26 | 1.2 | 1.19 | 1.17 | 1.16 | 1.05 | 1.02 | 0.99 | 0.99 |
| Germany | Austria | Italy | Netherlands | United Kingdom | Latvia | Sweden | |||||
| NOx | kt acid equivalents | 29.78 | 3.16 | 21.48 | 6 | 23.44 | 0.62 | 3.25 | |||
| SO2 | kt acid equivalents | 14.01 | 0.64 | 8.27 | 1.19 | 12.42 | 0.13 | 0.93 | |||
| NH3 | kt acid equivalents | 35.13 | 3.72 | 23.42 | 7.38 | 16.95 | 0.97 | 2.82 | |||
| emissions of acidifying substances | kt acid equivalents | 78.92 | 7.52 | 53.17 | 14.57 | 52.8 | 1.72 | 7 | |||
| country population | number | 82002356 | 8355260 | 60045068 | 16485787 | 61595091 | 2261294 | 9256347 | |||
| emissions per capita | kg/capita | 0.96 | 0.9 | 0.89 | 0.88 | 0.86 | 0.76 | 0.76 |


