[ZR06] Air pollution with nitrogen oxides

Definition
Nitrogen oxides (NOx) play an important role in air pollution phenomena such as acidification, eutrophication and photochemical smog. The main source of NOx within urban areas is use of fuel in traffic, combustion plants and power plants. Otherwise, nitrogen dioxide (NO2) concentrations are also determined by meteorological conditions. The amount of NOx is crucially influenced by ozone.
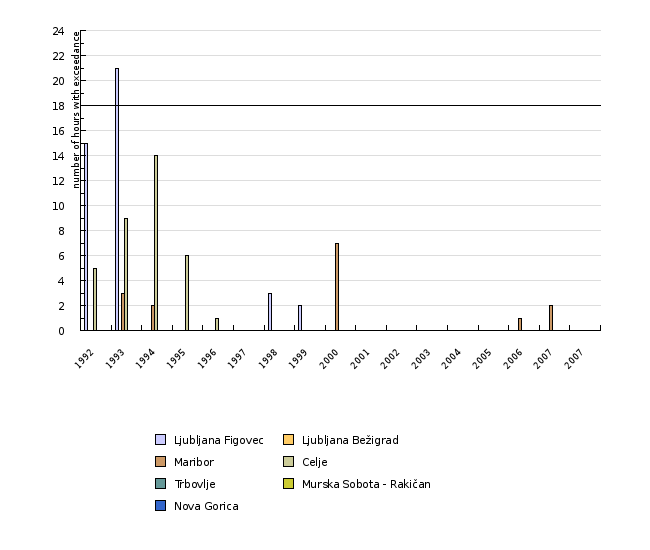
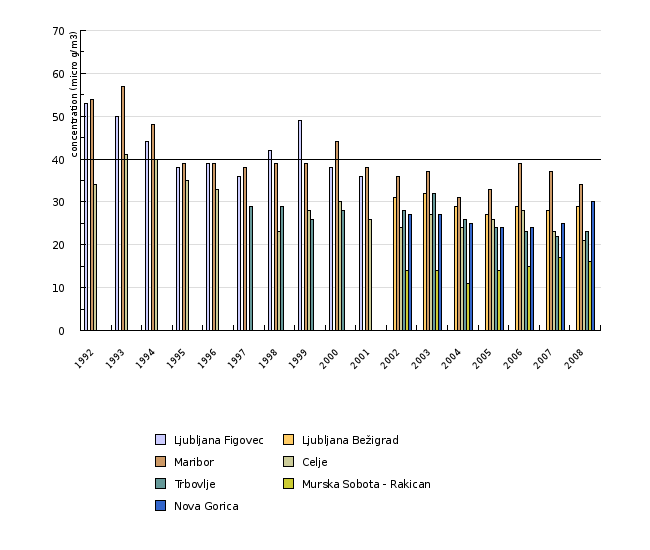
The indicator shows the frequency of exceeding the 1-hour limit concentration values of NO2 exceeding 200 μg/m3 and average annual NO2 concentrations (limit annual value is 40 μg/m3).
Charts
National authomatic measurement air quality network database, Environmental Agency of the Republic of Slovenia, 2008
| 1992 | 1993 | 1994 | 1995 | 1996 | 1997 | 1998 | 1999 | 2000 | 2001 | ||
|---|---|---|---|---|---|---|---|---|---|---|---|
| Ljubljana Figovec | number of hours | 15 | 21 | 0 | 0 | 0 | 0 | 3 | 2 | 0 | 0 |
| Ljubljana Bežigrad | number of hours | np | np | np | np | np | np | np | np | np | np |
| Maribor | number of hours | 0 | 3 | 2 | 0 | 0 | 0 | 0 | 0 | 7 | 0 |
| Celje | number of hours | 5 | 9 | 14 | 6 | 1 | np | 0 | 0 | 0 | 0 |
| Trbovlje | number of hours | np | np | np | np | np | 0 | 0 | 0 | 0 | 0 |
| Murska Sobota - Rakičan | number of hours | np | np | np | np | np | np | np | np | np | np |
| Nova Gorica | number of hours | np | np | np | np | np | np | np | np | np | np |
| 2002 | 2003 | 2004 | 2005 | 2006 | 2007 | 2007 | |||||
| Ljubljana Figovec | number of hours | 0 | np | np | np | np | np | np | |||
| Ljubljana Bežigrad | number of hours | np | 0 | 0 | 0 | 0 | 0 | 0 | |||
| Maribor | number of hours | 0 | 0 | 0 | 0 | 1 | 2 | 0 | |||
| Celje | number of hours | 0 | 0 | 0 | 0 | 0 | 0 | 0 | |||
| Trbovlje | number of hours | 0 | 0 | 0 | 0 | 0 | 0 | 0 | |||
| Murska Sobota - Rakičan | number of hours | 0 | 0 | 0 | 0 | 0 | 0 | 0 | |||
| Nova Gorica | number of hours | 0 | 0 | 0 | 0 | 0 | 0 | 0 |
National authomatic measurement air quality network database, Environmental Agency of the Republic of Slovenia, 2008
| 1992 | 1993 | 1994 | 1995 | 1996 | 1997 | 1998 | 1999 | 2000 | 2001 | ||
|---|---|---|---|---|---|---|---|---|---|---|---|
| Ljubljana Figovec | µg/m3 | 53 | 50 | 44 | 38 | 39 | 36 | 42 | 49 | 38 | 36 |
| Ljubljana Bežigrad | µg/m3 | np | np | np | np | np | np | np | np | np | np |
| Maribor | µg/m3 | 54 | 57 | 48 | 39 | 39 | 38 | 39 | 39 | 44 | 38 |
| Celje | µg/m3 | 34 | 41 | 40 | 35 | 33 | np | 23 | 28 | 30 | 26 |
| Trbovlje | µg/m3 | np | np | np | np | np | 29 | 29 | 26 | 28 | np |
| Murska Sobota - Rakican | µg/m3 | np | np | np | np | np | np | np | np | np | np |
| Nova Gorica | µg/m3 | np | np | np | np | np | np | np | np | np | np |
| 2002 | 2003 | 2004 | 2005 | 2006 | 2007 | 2008 | |||||
| Ljubljana Figovec | µg/m3 | np | np | np | np | np | np | np | |||
| Ljubljana Bežigrad | µg/m3 | 31 | 32 | 29 | 27 | 29 | 28 | 29 | |||
| Maribor | µg/m3 | 36 | 37 | 31 | 33 | 39 | 37 | 34 | |||
| Celje | µg/m3 | 24 | 27 | 24 | 26 | 28 | 23 | 21 | |||
| Trbovlje | µg/m3 | 28 | 32 | 26 | 24 | 23 | 22 | 23 | |||
| Murska Sobota - Rakican | µg/m3 | 14 | 14 | 11 | 14 | 15 | 17 | 16 | |||
| Nova Gorica | µg/m3 | 27 | 27 | 25 | 24 | 24 | 25 | 30 |
Goals
The main aim of air quality management is reduction of air pollution in Slovenia caused by NO2, as stated in the Decree on Sulphur Dioxide, Nitrogen oxides, Particulate Matter and Lead in Ambient Air (OJ RS, No 52/02) and the EU Directive (1999/30/EC). Legislation provides that average 1-hour concentration of NO2 may not exceed the limit value of 200 μg/m3 more than 18 times per calendar year. Annual NO2 concentration, however, may not exceed 40 μg/m3. Air emission management and pollution reduction is also a target of the National Environmental Action Programme.
Comment
NO2 concentrations have specific daily and weekly cycle, caused by traffic jams and annual cycle, caused by weather conditions, which are more favourable in the summer. The highest NO2 concentrations are found at roadside locations. The use of catalytic converters in vehicles led to a reduction in emissions, but due to increased traffic not significant. Figure 17-1 clearly shows that in urban areas Slovenia has already achieved the required standards relating to exceedances of 1-hour limit values at individual monitoring sites, since 2001 there was none recorded. Average annual values of NO2 (Figure 17-2), as well, have been maintained below the limit value and individual monitoring sites show a slight downward trend. Reduction of NO2 concentrations affects favourably to human health, since long-term exposure to high concentration can lead to respiratory organ infections.
Analyses of NO2 concentration measurements in other European countries indicate a slightly downward trend in annual value since 1996.
Methodology
The data for Slovenia are taken from the National authomatic measurement air quality network database maintained at the Monitoring Office (Environmental Agency of the Republic of Slovenia). The database is updated monthly; the data are available in their entirety upon the completion of final annual review.
Information on the ANAS automatic network monitoring sites: Ljubljana had two monitoring sites – Figovec and Bežigrad. By the end of 2001, Figovec monitoring site was put out of operation, Ljubljana Bežigrad monitoring site is not under dirrect traffic unfluence, but still are the concentrations measured here among the highest. The monitoring site in Maribor and Trbopvlje are located directly at the carriageway in the city centre, near an intersection; therefore the air samples show a higher level of traffic-related pollution. In Celje, measurements are taken in the hospital complex located just outside the city centre, with lower concentrations measured. Monitoring site in Nova Gorica is placed on the edge of the city. The Rakičan by Murska Sobota monitoring site is representative foer rural area in the vicinity of a town.


