[PP06] Annual growing season length

Key message

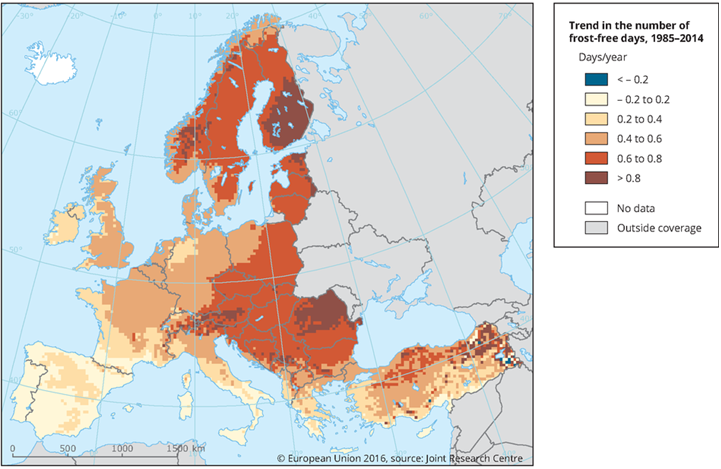
The length of the annual growing season is increasing almost everywhere in Europe, mostly in Eastern and Northern part, and less in Western Europe, the Mediterranean and in southern Europe. In Slovenia, the length of the annual growing season is increasing, especially since the mid-1990s. According to projections, the duration of the annual growing season throughout Europe will increase in the future. This will affect the expansion of more thermally demanding plants to areas towards the north of Europe, where the cultivation of such plants has not been possible so far, and in the southern part of Europe where changed thermal conditions will allow the growing season to extend towards the winter season. Mostly, in all parts of Central and South-Eastern Europe, dry and hot summers will hamper crop production.
Definition
The length of the annual growing season is the period between the day when the average daily air temperature in spring exceeds 5°C and the day when it drops below this value in autumn.
An air temperature of 5°C is generally recognised to be the lowest temperature threshold for plant vegetation. The 5°C temperature threshold is also used as one of the conditions for the classification of agro-ecological zones. In the context of climate change, it enables assessing the impact of changing climate on the development of plants and their environment. This indicator also serves as a tool in preparing for adaptation to new conditions, thus minimising the potential negative impacts of climate change.
Charts
Meteorological data archive, Slovenian Environment Agency, 2019
| 1961-1990[number of days] | 1991-2018[number of days] | |
|---|---|---|
| Ljubljana | 243 | 258 |
| Novo mesto | 238 | 252 |
| Bilje | 278 | 282 |
| Slap pri Vipavi | 276 | 286 |
| Murska Sobota | 237 | 246 |
| Maribor | 243 | 250 |
| Rateče | 187 | 203 |
Meteorological data archive, Slovenian Environment Agency, 2019
| growing season[number of days] | 5-y running average[number of days] | |
|---|---|---|
| 1961 | 279 | |
| 1962 | 227 | |
| 1963 | 249 | 250.80 |
| 1964 | 256 | 240.20 |
| 1965 | 243 | 248.40 |
| 1966 | 226 | 247.20 |
| 1967 | 268 | 243 |
| 1968 | 243 | 241.20 |
| 1969 | 235 | 245.40 |
| 1970 | 234 | 245.80 |
| 1971 | 247 | 240.40 |
| 1972 | 270 | 238.60 |
| 1973 | 216 | 244.80 |
| 1974 | 226 | 243.20 |
| 1975 | 265 | 244.80 |
| 1976 | 239 | 252.60 |
| 1977 | 278 | 256.60 |
| 1978 | 255 | 248 |
| 1979 | 246 | 249.40 |
| 1980 | 222 | 238.20 |
| 1981 | 246 | 234.60 |
| 1982 | 222 | 232.40 |
| 1983 | 237 | 230 |
| 1984 | 235 | 229.40 |
| 1985 | 210 | 229.80 |
| 1986 | 243 | 228 |
| 1987 | 224 | 231.40 |
| 1988 | 228 | 241.40 |
| 1989 | 252 | 240.20 |
| 1990 | 260 | 252.20 |
| 1991 | 237 | 251 |
| 1992 | 284 | 255.60 |
| 1993 | 222 | 249.80 |
| 1994 | 275 | 251.60 |
| 1995 | 231 | 244.60 |
| 1996 | 246 | 246.20 |
| 1997 | 249 | 243.40 |
| 1998 | 230 | 254 |
| 1999 | 261 | 254 |
| 2000 | 284 | 260.20 |
| 2001 | 246 | 261.60 |
| 2002 | 280 | 263.20 |
| 2003 | 237 | 256.20 |
| 2004 | 269 | 261.60 |
| 2005 | 249 | 258.80 |
| 2006 | 273 | 259.20 |
| 2007 | 266 | 262.40 |
| 2008 | 239 | 263.20 |
| 2009 | 285 | 258 |
| 2010 | 253 | 260 |
| 2011 | 247 | 259 |
| 2012 | 276 | 264 |
| 2013 | 235 | 267 |
| 2014 | 310 | 268 |
| 2015 | 265 | 268 |
| 2016 | 256 | 258 |
| 2017 | 272 | |
| 2018 | 236 |
Atlas podnebnih sprememb, 2019
The timeline of change is shown for temperature threshold 5 °C for two scenarios relative to the reference period 1981-2010. Bold coloured curves show smoothed model median and lighter colours show model spread. Under RCP4.5 the growing season length will increase by approximately 25 days and under RCP8.5 by approximately 60 days.
Goals
• To estimate the effect of climate change on plant development.
• To prepare adaptation procedures for the newly arising climatic conditions and mitigation of possible adverse effects.


