[PP04] Temperature

Key message

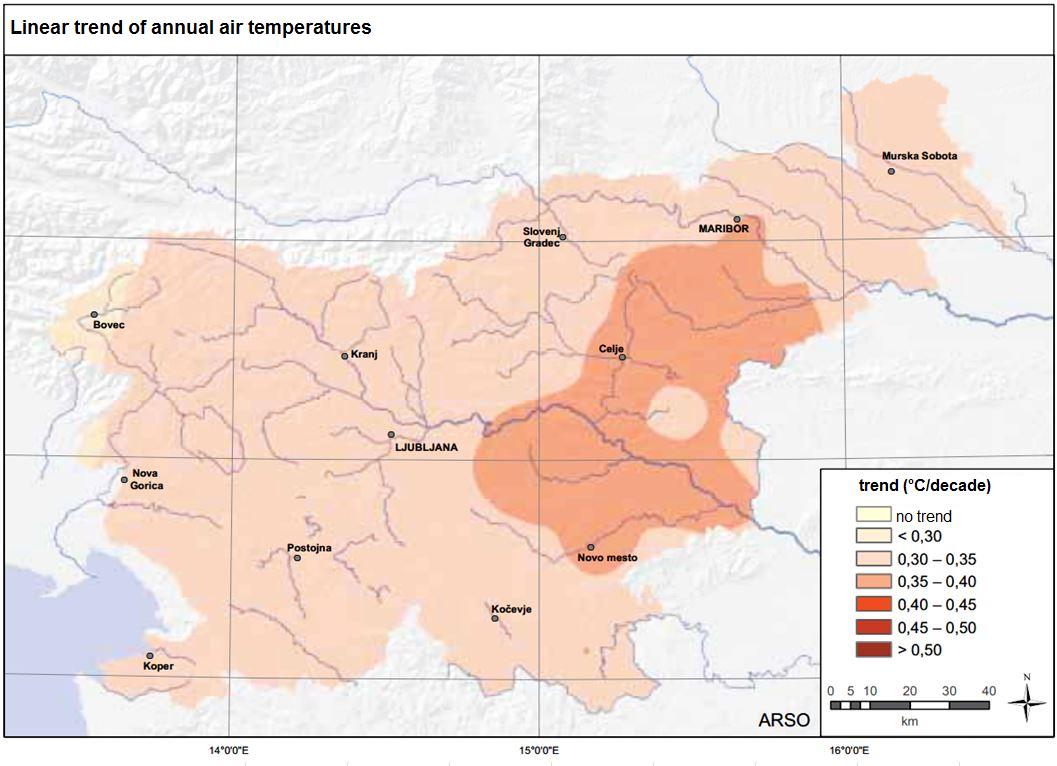
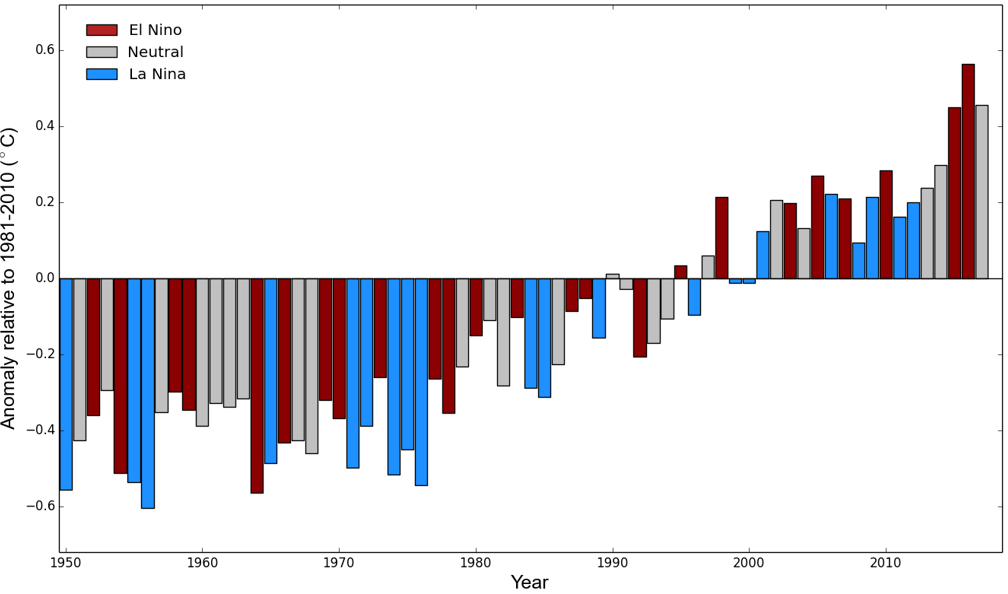
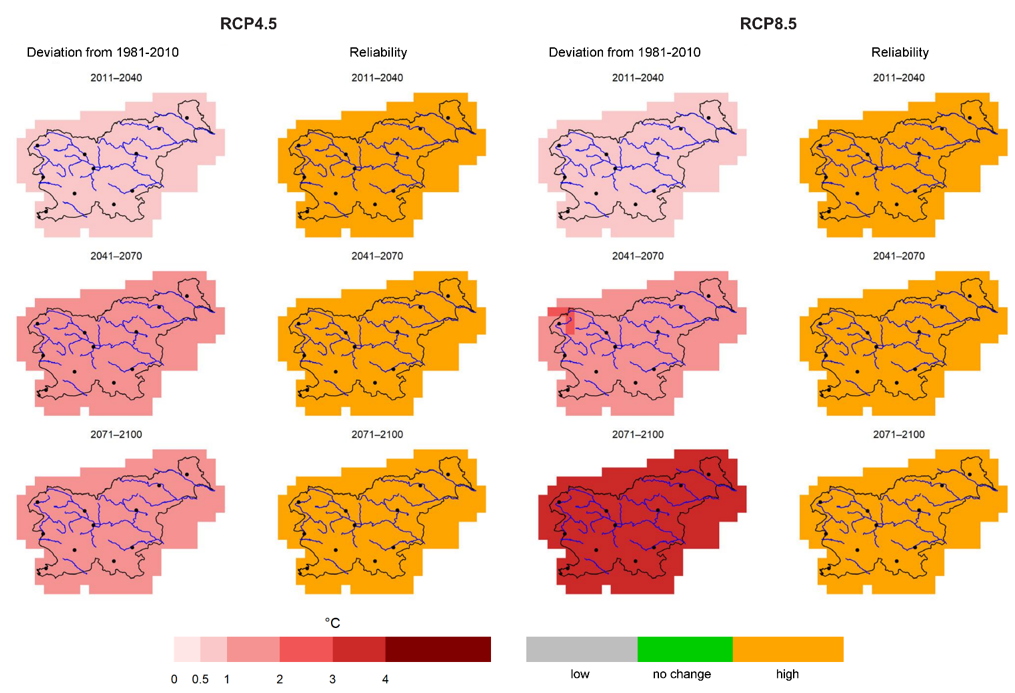
Temperature in Slovenia increases faster than global average. Increase in the annual average temperature is most evident in last three decades. Warming of atmosphere will continue according to the climate change projections. The result of warming is an increase in sea level (due to melting of glaciers), increase in level of the greenhouse gases in atmosphere (contributes to warming), and many extreme weather and climate events (like floods, droughts, hail and heavy wind), what will result in the quality of our lives.
Charts
Agencija RS za okolje, 2019
| Kredarica[°C] | Rateče[°C] | Murska Sobota[°C] | Novo mesto[°C] | Ljubljana[°C] | |
|---|---|---|---|---|---|
| 1961 | -0.50 | 6.70 | 10 | 9.90 | 10.50 |
| 1962 | -2.70 | 4.90 | 8.40 | 8.30 | 9 |
| 1963 | -2.10 | 5.50 | 8.50 | 8.80 | 9.30 |
| 1964 | -1.20 | 5.80 | 8.80 | 8.90 | 9.60 |
| 1965 | -2.60 | 4.80 | 8.70 | 8.60 | 9 |
| 1966 | -1.80 | 6.30 | 9.90 | 9.90 | 10.40 |
| 1967 | -1.20 | 6.10 | 9.70 | 9.60 | 10.30 |
| 1968 | -2 | 5.60 | 9.10 | 9.40 | 9.80 |
| 1969 | -2.10 | 5.40 | 8.70 | 8.80 | 9.50 |
| 1970 | -2.20 | 5.30 | 9 | 9 | 9.70 |
| 1971 | -1.70 | 5.70 | 9.10 | 9 | 9.60 |
| 1972 | -1.80 | 5.40 | 9 | 9.20 | 9.60 |
| 1973 | -1.90 | 5.50 | 8.90 | 9.20 | 9.60 |
| 1974 | -2.10 | 6.10 | 9.90 | 10 | 10.40 |
| 1975 | -1.30 | 6.10 | 9.80 | 10 | 10.30 |
| 1976 | -2.30 | 5.70 | 8.90 | 9.10 | 9.50 |
| 1977 | -1.30 | 6 | 9.70 | 10.10 | 10.30 |
| 1978 | -2 | 4.60 | 8.30 | 8.60 | 8.80 |
| 1979 | -2 | 5.40 | 9.30 | 9.80 | 9.90 |
| 1980 | -2.40 | 4.80 | 8.20 | 8.80 | 9 |
| 1981 | -2.10 | 5.50 | 9.50 | 9.80 | 9.70 |
| 1982 | -1 | 6.10 | 9.60 | 10 | 10.30 |
| 1983 | -0.70 | 6.20 | 9.70 | 10.10 | 10.20 |
| 1984 | -2.40 | 5.30 | 8.90 | 9.40 | 9.50 |
| 1985 | -1.60 | 5.50 | 8.50 | 8.90 | 9.30 |
| 1986 | -1.30 | 5.60 | 9 | 9.10 | 9.50 |
| 1987 | -1.40 | 5.70 | 9 | 9.50 | 9.60 |
| 1988 | -1.20 | 6.30 | 9.90 | 10.20 | 10.50 |
| 1989 | -0.30 | 6.50 | 10.10 | 10.30 | 10.40 |
| 1990 | -0.60 | 6.50 | 10.20 | 10.50 | 10.70 |
| 1991 | -1.60 | 5.50 | 9.30 | 9.60 | 10 |
| 1992 | -0.20 | 7 | 10.90 | 10.80 | 11.10 |
| 1993 | -1.10 | 6.40 | 10 | 10.30 | 10.60 |
| 1994 | -0.10 | 7.60 | 11.30 | 11.50 | 11.80 |
| 1995 | -1.40 | 6.40 | 10.10 | 10.30 | 10.70 |
| 1996 | -1.90 | 5.80 | 9 | 9.30 | 9.80 |
| 1997 | -0.60 | 6.70 | 9.70 | 10.10 | 10.80 |
| 1998 | -0.90 | 6.80 | 10.10 | 10.60 | 11 |
| 1999 | -1 | 6.70 | 10.30 | 10.60 | 11 |
| 2000 | 0 | 7.60 | 11.50 | 12 | 12.20 |
| 2001 | -1 | 7.10 | 10.60 | 11.10 | 11.40 |
| 2002 | -0.20 | 7.70 | 11.30 | 11.50 | 11.80 |
| 2003 | -0.40 | 7.10 | 10.60 | 11.10 | 11.60 |
| 2004 | -1.10 | 6.40 | 9.80 | 10.20 | 10.70 |
| 2005 | -1.60 | 5.90 | 9.50 | 10 | 10.50 |
| 2006 | -0.30 | 6.90 | 10.20 | 11 | 11.40 |
| 2007 | -0.30 | 7.60 | 11.20 | 11.60 | 12.10 |
| 2008 | -0.60 | 7.20 | 11.20 | 11.30 | 11.60 |
| 2009 | -0.70 | 7.10 | 10.90 | 11.40 | 11.70 |
| 2010 | -1.80 | 6.60 | 10.20 | 10.30 | 10.70 |
| 2011 | 0.20 | 7.60 | 10.70 | 11.30 | 11.80 |
| 2012 | -0.30 | 7.30 | 11.20 | 11.60 | 12 |
| 2013 | -0.60 | 7.20 | 11 | 11.20 | 11.70 |
| 2014 | 0 | 8 | 12 | 12.30 | 12.70 |
| 2015 | 0.60 | 7.90 | 11.50 | 12 | 12.20 |
| 2016 | -0.30 | 7.50 | 11.10 | 11.40 | 11.80 |
| 2017 | -0.20 | 7.20 | 11 | 11.50 | 11.90 |
| 2018 | 0.20 | 8 | 11.80 | 11.80 | 12.50 |
Slovenian Environment Agency, 2013
World Meteorological Organization, 2013
| global temprerature (°C) | average (°C) | |
|---|---|---|
| 1881-1890 | 13.68 | |
| 1891-1900 | 13.67 | |
| 1901-1910 | 13.59 | |
| 1911-1920 | 13.64 | |
| 1921-1930 | 13.76 | |
| 1931-1940 | 13.89 | |
| 1941-1950 | 13.95 | |
| 1951-1960 | 13.92 | |
| 1961-1970 | 13.93 | |
| 1971-1980 | 13.95 | |
| 1981-1990 | 14.12 | |
| 1991-2000 | 14.26 | |
| 2001-2010 | 14.47 |
World Meteorological Organization, 2018 (https://www.ncdc.noaa.gov/cag/global/time-series/nhem/land_ocean/ann/12/1950-2017)
Slovenian Environment Agency, 2018a
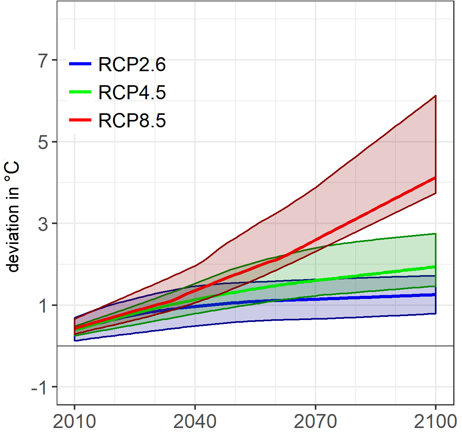
Comment to Figure PS04-5: The timeline of change in average annual air temperature in Slovenia over the 21st century for three scenarios relative to the reference period 1981-2010. Bold coloured curves show smoothed model median and lighter colours show model spread. Under RCP4.5 the average annual temperature will rise by approximately 2 °C and under RCP8.5 by approximately 4.1 °C.
Slovenian Environment Agency, 2013
Comment


