[PP04] Precipitations and temperature

Key message

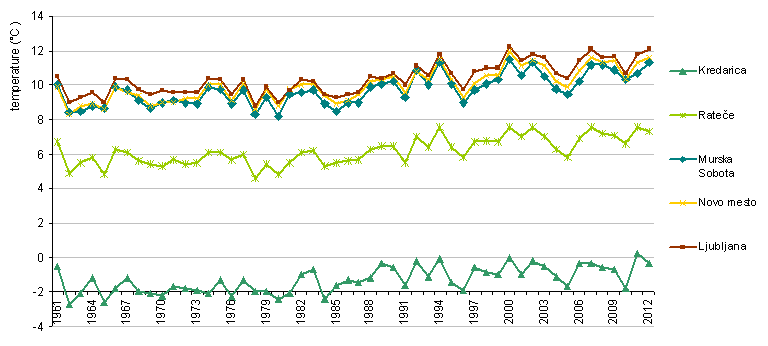
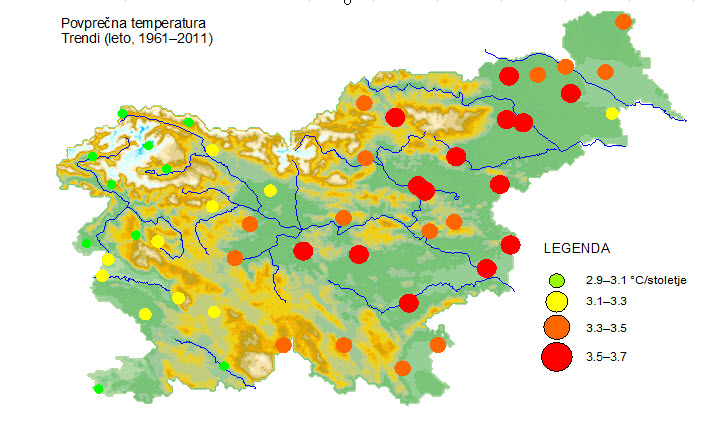
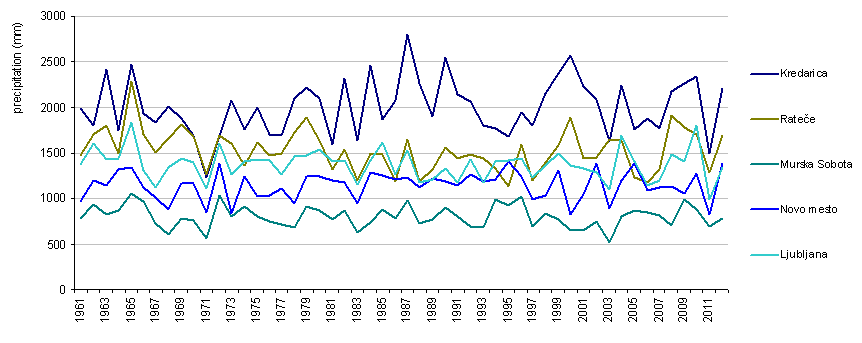
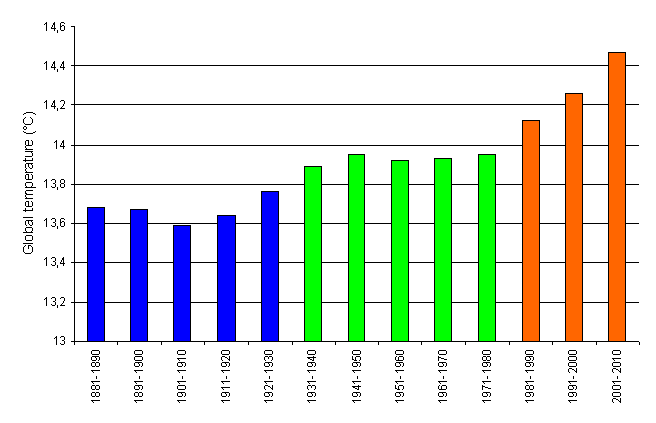
Temperature in Slovenia increases faster than global average. Increase in the annual anerage temperature is most evident in last three decades. Trends in annual precipitation are not as obvious as temperature trends, changes between years and regions are large. Warming of atmosphere will continue according to the climate change projections. Annual precipitation will not change significantly while there will be less precipitation, especially during summer.
Definition
Indicator shows changes of average annual air temperatures and average annual precipitation in selected areas across Slovenia in the period of 1961-2012.
Charts
Meteorological Office, Environmental Agency of the Republic of Slovenia, 2013.
| 1961 | 1962 | 1963 | 1964 | 1965 | 1966 | 1967 | 1968 | 1969 | 1970 | ||
|---|---|---|---|---|---|---|---|---|---|---|---|
| Kredarica | °C | -0.5 | -2.7 | -2.1 | -1.2 | -2.6 | -1.8 | -1.2 | -2 | -2.1 | -2.2 |
| Rateče | °C | 6.7 | 4.9 | 5.5 | 5.8 | 4.8 | 6.3 | 6.1 | 5.6 | 5.4 | 5.3 |
| Murska Sobota | °C | 10 | 8.4 | 8.5 | 8.8 | 8.7 | 9.9 | 9.7 | 9.1 | 8.7 | 9 |
| Novo mesto | °C | 9.9 | 8.3 | 8.8 | 8.9 | 8.6 | 9.9 | 9.6 | 9.4 | 8.8 | 9 |
| Ljubljana | °C | 10.5 | 9 | 9.3 | 9.6 | 9 | 10.4 | 10.3 | 9.8 | 9.5 | 9.7 |
| 1971 | 1972 | 1973 | 1974 | 1975 | 1976 | 1977 | 1978 | 1979 | 1980 | ||
| Kredarica | °C | -1.7 | -1.8 | -1.9 | -2.1 | -1.3 | -2.3 | -1.3 | -2 | -2 | -2.4 |
| Rateče | °C | 5.7 | 5.4 | 5.5 | 6.1 | 6.1 | 5.7 | 6 | 4.6 | 5.4 | 4.8 |
| Murska Sobota | °C | 9.1 | 9 | 8.9 | 9.9 | 9.8 | 8.9 | 9.7 | 8.3 | 9.3 | 8.2 |
| Novo mesto | °C | 9 | 9.2 | 9.2 | 10 | 10 | 9.1 | 10.1 | 8.6 | 9.8 | 8.8 |
| Ljubljana | °C | 9.6 | 9.6 | 9.6 | 10.4 | 10.3 | 9.5 | 10.3 | 8.8 | 9.9 | 9 |
| 1981 | 1982 | 1983 | 1984 | 1985 | 1986 | 1987 | 1988 | 1989 | 1990 | ||
| Kredarica | °C | -2.1 | -1 | -0.7 | -2.4 | -1.6 | -1.3 | -1.4 | -1.2 | -0.3 | -0.6 |
| Rateče | °C | 5.5 | 6.1 | 6.2 | 5.3 | 5.5 | 5.6 | 5.7 | 6.3 | 6.5 | 6.5 |
| Murska Sobota | °C | 9.5 | 9.6 | 9.7 | 8.9 | 8.5 | 9 | 9 | 9.9 | 10.1 | 10.2 |
| Novo mesto | °C | 9.8 | 10 | 10.1 | 9.4 | 8.9 | 9.1 | 9.5 | 10.2 | 10.3 | 10.5 |
| Ljubljana | °C | 9.7 | 10.3 | 10.2 | 9.5 | 9.3 | 9.5 | 9.6 | 10.5 | 10.4 | 10.7 |
| 1991 | 1992 | 1993 | 1994 | 1995 | 1996 | 1997 | 1998 | 1999 | 2000 | ||
| Kredarica | °C | -1.6 | -0.2 | -1.1 | -0.1 | -1.4 | -1.9 | -0.6 | -0.9 | -1 | 0 |
| Rateče | °C | 5.5 | 7 | 6.4 | 7.6 | 6.4 | 5.8 | 6.7 | 6.8 | 6.7 | 7.6 |
| Murska Sobota | °C | 9.3 | 10.9 | 10 | 11.3 | 10.1 | 9 | 9.7 | 10.1 | 10.3 | 11.5 |
| Novo mesto | °C | 9.6 | 10.8 | 10.3 | 11.5 | 10.3 | 9.3 | 10.1 | 10.6 | 10.6 | 12 |
| Ljubljana | °C | 10 | 11.1 | 10.6 | 11.8 | 10.7 | 9.8 | 10.8 | 11 | 11 | 12.2 |
| 2001 | 2002 | 2003 | 2004 | 2005 | 2006 | 2007 | 2008 | 2009 | 2010 | ||
| Kredarica | °C | -1 | -0.2 | -0.5 | -1.1 | -1.7 | -0.3 | -0.3 | -0.6 | -0.7 | -1.8 |
| Rateče | °C | 7 | 7.6 | 7 | 6.3 | 5.8 | 6.9 | 7.6 | 7.2 | 7.1 | 6.6 |
| Murska Sobota | °C | 10.6 | 11.3 | 10.5 | 9.8 | 9.5 | 10.2 | 11.2 | 11.2 | 10.9 | 10.3 |
| Novo mesto | °C | 11.1 | 11.4 | 11.1 | 10.2 | 9.9 | 10.9 | 11.6 | 11.3 | 11.4 | 10.3 |
| Ljubljana | °C | 11.4 | 11.8 | 11.6 | 10.7 | 10.4 | 11.4 | 12.1 | 11.6 | 11.7 | 10.7 |
| 2011 | 2012 | ||||||||||
| Kredarica | °C | 0.2 | -0.3 | ||||||||
| Rateče | °C | 7.6 | 7.3 | ||||||||
| Murska Sobota | °C | 10.7 | 11.3 | ||||||||
| Novo mesto | °C | 11.3 | 11.6 | ||||||||
| Ljubljana | °C | 11.8 | 12.1 |
Meteorological Office, Environmental Agency of the Republic of Slovenia, 2013.
| 1961 | 1962 | 1963 | 1964 | 1965 | 1966 | 1967 | 1968 | 1969 | 1970 | ||
|---|---|---|---|---|---|---|---|---|---|---|---|
| Kredarica | mm | 1984 | 1796 | 2416 | 1738 | 2469 | 1939 | 1836 | 2005 | 1880 | 1702 |
| Rateče | mm | 1478 | 1706 | 1805 | 1499 | 2290 | 1711 | 1514 | 1657 | 1807 | 1682 |
| Murska Sobota | mm | 786 | 931 | 832 | 866 | 1064 | 970 | 730 | 612 | 787 | 761 |
| Novo mesto | mm | 972 | 1202 | 1146 | 1319 | 1341 | 1117 | 1019 | 882 | 1165 | 1160 |
| Ljubljana | mm | 1372 | 1606 | 1431 | 1438 | 1839 | 1300 | 1119 | 1333 | 1445 | 1395 |
| 1971 | 1972 | 1973 | 1974 | 1975 | 1976 | 1977 | 1978 | 1979 | 1980 | ||
| Kredarica | mm | 1239 | 1702 | 2081 | 1750 | 1999 | 1703 | 1700 | 2096 | 2214 | 2099 |
| Rateče | mm | 1273 | 1692 | 1607 | 1359 | 1617 | 1480 | 1495 | 1736 | 1892 | 1638 |
| Murska Sobota | mm | 563 | 1033 | 809 | 912 | 805 | 751 | 718 | 676 | 912 | 862 |
| Novo mesto | mm | 855 | 1390 | 837 | 1250 | 1025 | 1038 | 1109 | 948 | 1250 | 1247 |
| Ljubljana | mm | 1107 | 1607 | 1270 | 1412 | 1435 | 1425 | 1265 | 1469 | 1475 | 1535 |
| 1981 | 1982 | 1983 | 1984 | 1985 | 1986 | 1987 | 1988 | 1989 | 1990 | ||
| Kredarica | mm | 1588 | 2325 | 1642 | 2456 | 1874 | 2079 | 2799 | 2256 | 1900 | 2545 |
| Rateče | mm | 1312 | 1532 | 1200 | 1497 | 1494 | 1192 | 1655 | 1191 | 1319 | 1553 |
| Murska Sobota | mm | 768 | 864 | 634 | 741 | 874 | 788 | 982 | 722 | 776 | 900 |
| Novo mesto | mm | 1199 | 1181 | 944 | 1296 | 1257 | 1213 | 1232 | 1115 | 1229 | 1192 |
| Ljubljana | mm | 1402 | 1418 | 1149 | 1424 | 1611 | 1265 | 1528 | 1178 | 1211 | 1331 |
| 1991 | 1992 | 1993 | 1994 | 1995 | 1996 | 1997 | 1998 | 1999 | 2000 | ||
| Kredarica | mm | 2148 | 2066 | 1802 | 1769 | 1680 | 1951 | 1800 | 2157 | 2376 | 2573 |
| Rateče | mm | 1441 | 1483 | 1446 | 1327 | 1129 | 1597 | 1195 | 1401 | 1579 | 1891 |
| Murska Sobota | mm | 804 | 689 | 677 | 989 | 924 | 1026 | 692 | 839 | 772 | 651 |
| Novo mesto | mm | 1140 | 1264 | 1188 | 1211 | 1405 | 1245 | 991 | 1041 | 1299 | 827 |
| Ljubljana | mm | 1182 | 1433 | 1177 | 1407 | 1423 | 1446 | 1230 | 1359 | 1501 | 1363 |
| 2001 | 2002 | 2003 | 2004 | 2005 | 2006 | 2007 | 2008 | 2009 | |||
| Kredarica | mm | 2230 | 2093 | 1623 | 2241 | 1752 | 1885 | 1761 | 2180 | 2259 | |
| Rateče | mm | 1440 | 1458 | 1653 | 1638 | 1237 | 1180 | 1311 | 1911 | 1782 | |
| Murska Sobota | mm | 643 | 754 | 515 | 804 | 869 | 852 | 817 | 708 | 989 | |
| Novo mesto | mm | 1051 | 1379 | 886 | 1197 | 1382 | 1084 | 1114 | 1135 | 1066 | |
| Ljubljana | mm | 1328 | 1288 | 1091 | 1696 | 1403 | 1141 | 1196 | 1490 | 1406 |
Archive meteorological data EARS, Office of Meteorology and EARS, 2013
| 1961 | 1962 | 1963 | 1964 | 1965 | 1966 | 1967 | 1968 | 1969 | 1970 | ||
|---|---|---|---|---|---|---|---|---|---|---|---|
| Kredarica | mm | 1984 | 1796 | 2416 | 1738 | 2469 | 1939 | 1836 | 2005 | 1880 | 1702 |
| Rateče | mm | 1478 | 1706 | 1805 | 1499 | 2290 | 1711 | 1514 | 1657 | 1807 | 1682 |
| Murska Sobota | mm | 786 | 931 | 832 | 866 | 1064 | 970 | 730 | 612 | 787 | 761 |
| Novo mesto | mm | 972 | 1202 | 1146 | 1319 | 1341 | 1117 | 1019 | 882 | 1165 | 1160 |
| Ljubljana | mm | 1372 | 1606 | 1431 | 1438 | 1839 | 1300 | 1119 | 1333 | 1445 | 1395 |
| 1971 | 1972 | 1973 | 1974 | 1975 | 1976 | 1977 | 1978 | 1979 | 1980 | ||
| Kredarica | mm | 1239 | 1702 | 2081 | 1750 | 1999 | 1703 | 1700 | 2096 | 2214 | 2099 |
| Rateče | mm | 1273 | 1692 | 1607 | 1359 | 1617 | 1480 | 1495 | 1736 | 1892 | 1638 |
| Murska Sobota | mm | 563 | 1033 | 809 | 912 | 805 | 751 | 718 | 676 | 912 | 862 |
| Novo mesto | mm | 855 | 1390 | 837 | 1250 | 1025 | 1038 | 1109 | 948 | 1250 | 1247 |
| Ljubljana | mm | 1107 | 1607 | 1270 | 1412 | 1435 | 1425 | 1265 | 1469 | 1475 | 1535 |
| 1981 | 1982 | 1983 | 1984 | 1985 | 1986 | 1987 | 1988 | 1989 | 1990 | ||
| Kredarica | mm | 1588 | 2325 | 1642 | 2456 | 1874 | 2079 | 2799 | 2256 | 1900 | 2545 |
| Rateče | mm | 1312 | 1532 | 1200 | 1497 | 1494 | 1192 | 1655 | 1191 | 1319 | 1553 |
| Murska Sobota | mm | 768 | 864 | 634 | 741 | 874 | 788 | 982 | 722 | 776 | 900 |
| Novo mesto | mm | 1199 | 1181 | 944 | 1296 | 1257 | 1213 | 1232 | 1115 | 1229 | 1192 |
| Ljubljana | mm | 1402 | 1418 | 1149 | 1424 | 1611 | 1265 | 1528 | 1178 | 1211 | 1331 |
| 1991 | 1992 | 1993 | 1994 | 1995 | 1996 | 1997 | 1998 | 1999 | 2000 | ||
| Kredarica | mm | 2148 | 2066 | 1802 | 1769 | 1680 | 1951 | 1800 | 2157 | 2376 | 2573 |
| Rateče | mm | 1441 | 1483 | 1446 | 1327 | 1129 | 1597 | 1195 | 1401 | 1579 | 1891 |
| Murska Sobota | mm | 804 | 689 | 677 | 989 | 924 | 1026 | 692 | 839 | 772 | 651 |
| Novo mesto | mm | 1140 | 1264 | 1188 | 1211 | 1405 | 1245 | 991 | 1041 | 1299 | 827 |
| Ljubljana | mm | 1182 | 1433 | 1177 | 1407 | 1423 | 1446 | 1230 | 1359 | 1501 | 1363 |
| 2001 | 2002 | 2003 | 2004 | 2005 | 2006 | 2007 | 2008 | 2009 | 2010 | ||
| Kredarica | mm | 2230 | 2093 | 1623 | 2241 | 1752 | 1885 | 1761 | 2180 | 2259 | 2343 |
| Rateče | mm | 1440 | 1458 | 1653 | 1638 | 1237 | 1180 | 1311 | 1911 | 1782 | 1703 |
| Murska Sobota | mm | 643 | 754 | 515 | 804 | 869 | 852 | 817 | 708 | 989 | 876 |
| Novo mesto | mm | 1051 | 1379 | 886 | 1197 | 1382 | 1084 | 1114 | 1135 | 1066 | 1278 |
| Ljubljana | mm | 1328 | 1288 | 1091 | 1696 | 1403 | 1141 | 1196 | 1490 | 1406 | 1798 |
| 2011 | 2012 | ||||||||||
| Kredarica | mm | 1497 | 2204 | ||||||||
| Rateče | mm | 1293 | 1701 | ||||||||
| Murska Sobota | mm | 693 | 782 | ||||||||
| Novo mesto | mm | 834 | 1387 | ||||||||
| Ljubljana | mm | 998 | 1339 |
World Meteorological Organization, The global climate 2001-2010, Decade of Climate Extremes, 2013.
| 1881-1890 | 1891-1900 | 1901-1910 | 1911-1920 | 1921-1930 | 1931-1940 | 1941-1950 | 1951-1960 | 1961-1970 | 1971-1980 | ||
|---|---|---|---|---|---|---|---|---|---|---|---|
| global temprerature (°C) | °C | 13.7 | 13.7 | 13.6 | 13.6 | 13.8 | 13.9 | 14 | 13.9 | 13.9 | 14 |
| average (°C) | °C | ||||||||||
| 1981-1990 | 1991-2000 | 2001-2010 | |||||||||
| global temprerature (°C) | °C | 14.1 | 14.3 | 14.5 | |||||||
| average (°C) | °C |
EEA, 2013.
EEA, 2013.


