[MR02] Sea level

Key message

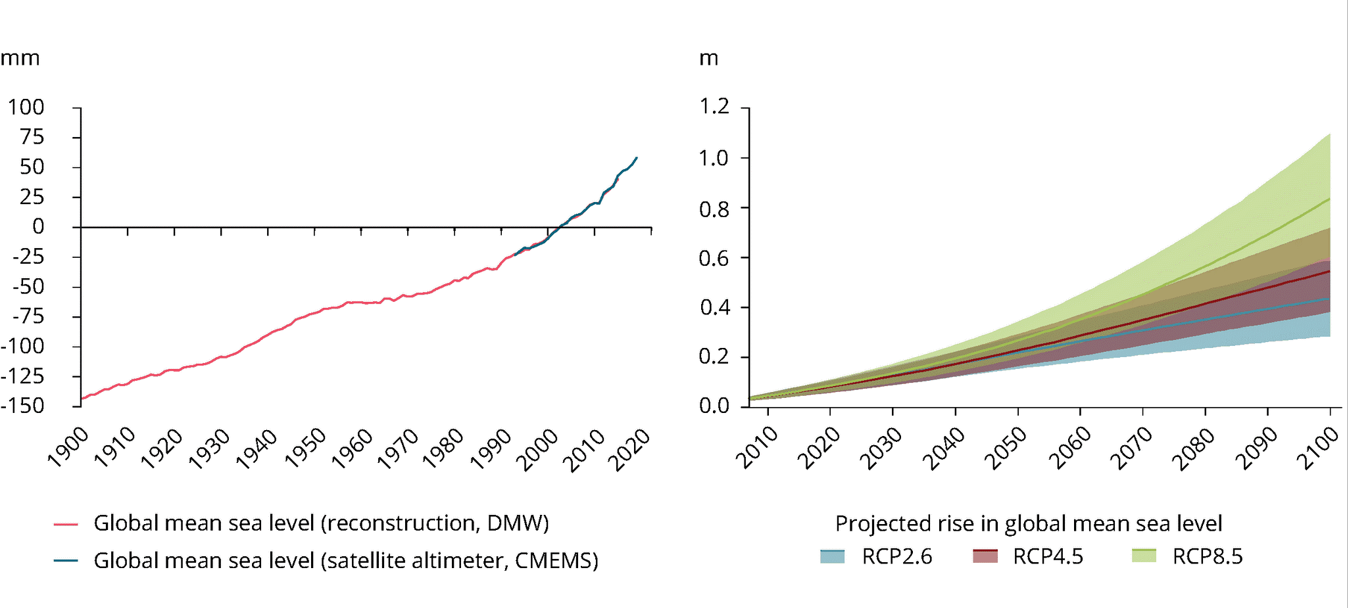
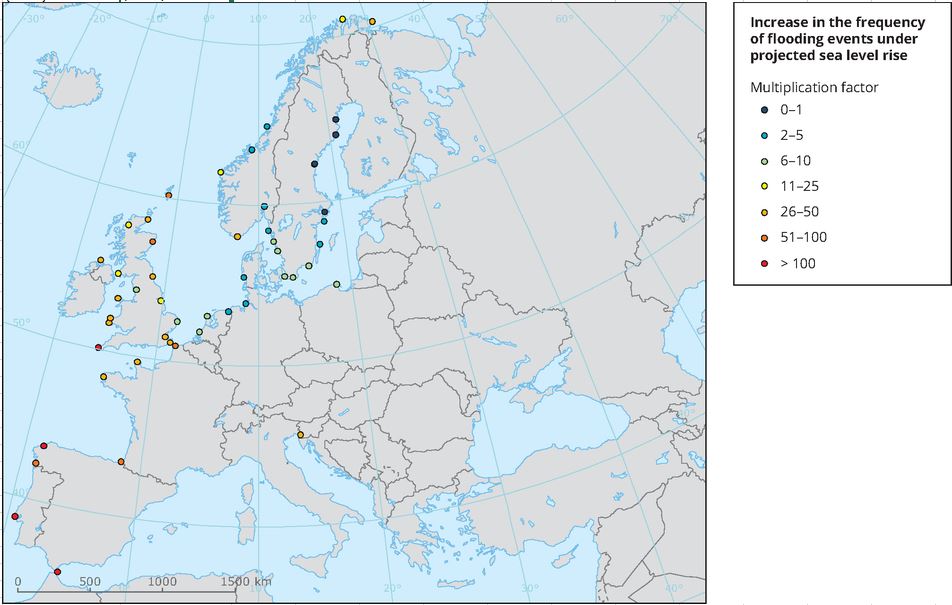
In the period 1960-2019, the mean sea level along the Slovenian coast increased by 11 cm. On average, this means by 1.8 mm/year and in the last 20 years by 4,4 mm/year. It is estimated that the increase of the middle sea level is affected by global see level increase, and in the last period also by extreme weather conditions in the region. In the last twenty years, at the Slovenian and in the Adriatic coast sea level has been rising faster than the European and global trends. In case the current trend continues, and if infrastructure adaptation will miss its goal, the daily flooding of low-lying urban areas of the Slovenian coast is expected by the end of the century. It is estimated that the Europe's sea level is going to rise by 20 to 80 cm. The frequency of floods will therefore be increased by a factor of 10 -100.
Definition
This indicator shows fluctuations of the average annual sea level in the Gulf of Koper from 1960 onwards, the highest annual sea level in Koper for the period 1963–2019, occurrence of extreme sea levels in Slovenia in the period 1960–2019, anticipated relative sea level changes by 2100 and increased frequency of flooding due to expected sea level changes by 2100.
The indicator indirectly follows the impact of climate change on sea level variation. Global sea level rise is mostly affected by global climate change and is reflected in the level of European seas. The sea level in Europe is monitored by satellite measurements that reflect the contribution of global climate change, as well as by measurements from tide gauges used for measuring sea levels at low and high tide. These reflect local sea level variation, which is important for the development of local strategies for adaptation to climate change.
Charts
Long-term sea level data Slovenian Environmental Agency, 2020 (6. 04. 2021)
| annual average level[cm] | maximal annual level[cm] | minimal annual level[cm] | annual average depth[index (1960 = 100)] | |
|---|---|---|---|---|
| 1960 | 218.25 | 238 | 190 | 100 |
| 1961 | 216.25 | 232 | 200 | 99.08 |
| 1962 | 213.08 | 233 | 199 | 97.63 |
| 1963 | 219.17 | 237 | 210 | 100.42 |
| 1964 | 210.50 | 225 | 189 | 96.45 |
| 1965 | 216.58 | 231 | 208 | 99.24 |
| 1966 | 219.75 | 236 | 206 | 100.69 |
| 1967 | 214.17 | 225 | 202 | 98.13 |
| 1968 | 215.33 | 233 | 205 | 98.66 |
| 1969 | 214.11 | 226 | 204 | 98.10 |
| 1970 | 219.67 | 240 | 212 | 100.65 |
| 1971 | 215.58 | 224 | 201 | 98.78 |
| 1972 | 214.75 | 220 | 203 | 98.40 |
| 1973 | 212.58 | 220 | 200 | 97.40 |
| 1974 | 216.08 | 230 | 204 | 99.01 |
| 1975 | 212.17 | 221 | 204 | 97.21 |
| 1976 | 215.17 | 231 | 199 | 98.59 |
| 1977 | 215.83 | 225 | 204 | 98.89 |
| 1978 | 217.25 | 227 | 204 | 99.54 |
| 1979 | 216.25 | 228 | 191 | 99.08 |
| 1980 | 216.83 | 234 | 204 | 99.35 |
| 1981 | 217 | 240 | 203 | 99.43 |
| 1982 | 216.25 | 231 | 205 | 99.08 |
| 1983 | 215.58 | 226 | 203 | 98.78 |
| 1984 | 218.08 | 231 | 209 | 99.92 |
| 1985 | 216.17 | 227 | 209 | 99.05 |
| 1986 | 217.83 | 230 | 210 | 99.81 |
| 1987 | 217.67 | 228 | 205 | 99.73 |
| 1988 | 217.25 | 223 | 211 | 99.54 |
| 1989 | 210.58 | 223 | 194 | 96.49 |
| 1990 | 210.67 | 229 | 192 | 96.53 |
| 1991 | 211.85 | 226.30 | 200.30 | 97.07 |
| 1992 | 215.84 | 242.80 | 195.20 | 98.90 |
| 1993 | 216.77 | 236.60 | 195.80 | 99.32 |
| 1994 | 220.86 | 226.20 | 208.70 | 101.20 |
| 1995 | 218.61 | 230.10 | 212.20 | 100.16 |
| 1996 | 220.42 | 238.40 | 206.60 | 100.99 |
| 1997 | 216.12 | 233.80 | 192.20 | 99.02 |
| 1998 | 217.03 | 228.50 | 199.50 | 99.44 |
| 1999 | 218.71 | 226 | 210.90 | 100.21 |
| 2000 | 219.08 | 240.60 | 203.80 | 100.38 |
| 2001 | 219.12 | 230.79 | 207.11 | 100.40 |
| 2002 | 217.39 | 234.53 | 199.91 | 99.61 |
| 2003 | 216.70 | 227.60 | 201.80 | 99.29 |
| 2004 | 222 | 234 | 211 | 101.72 |
| 2005 | 220 | 226 | 208 | 100.80 |
| 2006 | 223 | 233 | 210 | 102.18 |
| 2007 | 220.70 | 228 | 212 | 101.12 |
| 2008 | 221.70 | 233.40 | 198.20 | 101.58 |
| 2009 | 227.30 | 244 | 219 | 104.15 |
| 2010 | 234 | 250 | 217 | 107.22 |
| 2011 | 221 | 229 | 214.70 | 101.26 |
| 2012 | 222 | 237 | 201 | 101.72 |
| 2013 | 228 | 241 | 217 | 104.47 |
| 2014 | 231 | 246 | 220 | 105.84 |
| 2015 | 223 | 234 | 209 | 102.18 |
| 2016 | 225 | 236 | 206 | 103.09 |
| 2017 | 220.40 | 230 | 208 | 100.99 |
| 2018 | 228 | 245 | 220 | 104.47 |
| 2019 | 227 | 259 | 212 | 104.01 |
Long-term sea level data Slovenian Environmental Agency, 2020 (6. 04. 2021)
| maximal sea level[cm] | |
|---|---|
| 1963 | 314 |
| 1964 | 313 |
| 1965 | 323 |
| 1966 | 352 |
| 1967 | 327 |
| 1968 | 330 |
| 1969 | 394 |
| 1970 | 325 |
| 1971 | 310 |
| 1972 | 320 |
| 1973 | 314 |
| 1974 | 308 |
| 1975 | 331 |
| 1976 | 325 |
| 1977 | 320 |
| 1978 | 318 |
| 1979 | 356 |
| 1980 | 361 |
| 1981 | 330 |
| 1982 | 361 |
| 1983 | 316 |
| 1984 | 326 |
| 1985 | 326 |
| 1986 | 345 |
| 1987 | 309 |
| 1988 | 305 |
| 1989 | 320 |
| 1990 | 311 |
| 1991 | 333 |
| 1992 | 327 |
| 1993 | 340 |
| 1994 | 310 |
| 1995 | 334 |
| 1996 | 329 |
| 1997 | 330 |
| 1998 | 320 |
| 1999 | 319 |
| 2000 | 321 |
| 2001 | 311 |
| 2002 | 325 |
| 2003 | 305 |
| 2004 | 342 |
| 2005 | 322 |
| 2006 | 316 |
| 2007 | 326 |
| 2008 | 372 |
| 2009 | 338 |
| 2010 | 342 |
| 2011 | 321 |
| 2012 | 335 |
| 2013 | 350 |
| 2014 | 328 |
| 2015 | 318 |
| 2016 | 343 |
| 2017 | 317 |
| 2018 | 343 |
| 2019 | 372 |
Long-term sea level data Slovenian Environmental Agency, 2020 (6. 04. 2021)
| number of days per year when the high water exceeded 3m[number of days per year] | |
|---|---|
| 1961 | 3 |
| 1962 | 7 |
| 1963 | 11 |
| 1964 | 5 |
| 1965 | 10 |
| 1966 | 9 |
| 1967 | 6 |
| 1968 | 8 |
| 1969 | 7 |
| 1970 | 6 |
| 1971 | 4 |
| 1972 | 2 |
| 1973 | 2 |
| 1974 | 3 |
| 1975 | 3 |
| 1976 | 4 |
| 1977 | 1 |
| 1978 | 5 |
| 1979 | 15 |
| 1980 | 5 |
| 1981 | 11 |
| 1982 | 7 |
| 1983 | 8 |
| 1984 | 10 |
| 1985 | 3 |
| 1986 | 4 |
| 1987 | 6 |
| 1988 | 1 |
| 1989 | 2 |
| 1990 | 7 |
| 1991 | 3 |
| 1992 | 16 |
| 1993 | 9 |
| 1994 | 5 |
| 1995 | 7 |
| 1996 | 16 |
| 1997 | 16 |
| 1998 | 7 |
| 1999 | 10 |
| 2000 | 12 |
| 2001 | 8 |
| 2002 | 10 |
| 2003 | 3 |
| 2004 | 16 |
| 2005 | 3 |
| 2006 | 6 |
| 2007 | 4 |
| 2008 | 14 |
| 2009 | 25 |
| 2010 | 31 |
| 2011 | 2 |
| 2012 | 20 |
| 2013 | 19 |
| 2014 | 24 |
| 2015 | 10 |
| 2016 | 11 |
| 2017 | 5 |
| 2018 | 15 |
| 2019 | 31 |
EEA, Global and European sea level rise (6. 04. 2021)
| reconstruction[mm] | satelite altimeter[mm] | uncertainty range[mm] | uncertainty low[mm] | uncerttainty high[mm] | |
|---|---|---|---|---|---|
| 1960 | -42.70 | 0 | 6.60 | -49.30 | -36.10 |
| 1961 | -36.50 | 0 | 6.60 | -43.10 | -29.90 |
| 1962 | -41.70 | 0 | 6.60 | -48.30 | -35.10 |
| 1963 | -43.30 | 0 | 6.60 | -49.90 | -36.70 |
| 1964 | -51.20 | 0 | 6.70 | -57.90 | -44.50 |
| 1965 | -40 | 0 | 6.70 | -46.70 | -33.30 |
| 1966 | -45.40 | 0 | 6.60 | -52 | -38.80 |
| 1967 | -44 | 0 | 6.50 | -50.50 | -37.50 |
| 1968 | -43.20 | 0 | 6.70 | -49.90 | -36.50 |
| 1969 | -36.40 | 0 | 7 | -43.40 | -29.40 |
| 1970 | -38.30 | 0 | 7 | -45.30 | -31.30 |
| 1971 | -33.10 | 0 | 6.90 | -40 | -26.20 |
| 1972 | -24 | 0 | 6.90 | -30.90 | -17.10 |
| 1973 | -30 | 0 | 6.80 | -36.80 | -23.20 |
| 1974 | -18.10 | 0 | 6.80 | -24.90 | -11.30 |
| 1975 | -19.70 | 0 | 6.70 | -26.40 | -13 |
| 1976 | -20.70 | 0 | 6.80 | -27.50 | -13.90 |
| 1977 | -22.40 | 0 | 6.60 | -29 | -15.80 |
| 1978 | -16 | 0 | 6.70 | -22.70 | -9.30 |
| 1979 | -20.90 | 0 | 6.70 | -27.60 | -14.20 |
| 1980 | -14.90 | 0 | 6.50 | -21.40 | -8.40 |
| 1981 | -2.50 | 0 | 6.50 | -9 | 4 |
| 1982 | -8.30 | 0 | 6.30 | -14.60 | -2 |
| 1983 | 0.10 | 0 | 6.50 | -6.40 | 6.60 |
| 1984 | -0.80 | 0 | 6.30 | -7.10 | 5.50 |
| 1985 | -11.10 | 0 | 6.30 | -17.40 | -4.80 |
| 1986 | -10.50 | 0 | 6.30 | -16.80 | -4.20 |
| 1987 | -9.90 | 0 | 6.20 | -16.10 | -3.70 |
| 1988 | -5.20 | 0 | 6.30 | -11.50 | 1.10 |
| 1989 | -0.70 | 0 | 6.40 | -7.10 | 5.70 |
| 1990 | 0.70 | 0 | 6.30 | -5.60 | 7 |
| 1991 | 3.80 | 0 | 6.30 | -2.50 | 10.10 |
| 1992 | 6.60 | 0 | 6.40 | 0.20 | 13 |
| 1993 | 2.10 | 0.20 | 6.40 | -4.30 | 8.50 |
| 1994 | 5.50 | 1.50 | 6.40 | -0.90 | 11.90 |
| 1995 | 10.70 | 4.50 | 6.40 | 4.30 | 17.10 |
| 1996 | 14.40 | 10.10 | 6.40 | 8 | 20.80 |
| 1997 | 22.60 | 14.80 | 6.50 | 16.10 | 29.10 |
| 1998 | 15 | 20.70 | 6.60 | 8.40 | 21.60 |
| 1999 | 21.70 | 20.90 | 6.70 | 15 | 28.40 |
| 2000 | 22.60 | 23.70 | 6.60 | 16 | 29.20 |
| 2001 | 27.10 | 28.40 | 6.50 | 20.60 | 33.60 |
| 2002 | 26.10 | 32.10 | 6.70 | 19.40 | 32.80 |
| 2003 | 35.10 | 34.10 | 6.90 | 28.20 | 42 |
| 2004 | 34.50 | 36.40 | 7.20 | 27.30 | 41.70 |
| 2005 | 34.10 | 40.10 | 7.30 | 26.80 | 41.40 |
| 2006 | 35.60 | 41.70 | 7.40 | 28.20 | 43 |
| 2007 | 39.10 | 42 | 8 | 31.10 | 47.10 |
| 2008 | 49 | 47.30 | 8.40 | 40.60 | 57.40 |
| 2009 | 55.50 | 52.30 | 8.80 | 46.70 | 64.30 |
| 2010 | 53.60 | ||||
| 2011 | 53.40 | ||||
| 2012 | 64.10 | ||||
| 2013 | 66.60 |
EEA, Global and European sea level rise (6. 04. 2021)
According to the RCP4.5 scenario.
EEA, Global and European sea level rise (6. 04. 2021)
According to the RCP4.5 scenario.
Goals
- Providing information to managing authorities that allows for better adaptation to anticipated changes.
- Early detection of current and long-term sea level deviations, which will improve forecasting of and warning against extraordinary hydrological events at sea.
The European Union has adopted the EU Strategy on adaptation to climate change. It includes measures such as building of infrastructure for flood protection, reduction of water consumption, adaptation of building regulations and development of drought-resistant crops. Each Member State is obliged to prepare its own strategy on adaptation to climate change by 2017.
Comment
In the Gulf of Koper, sea level changes have been monitored since 1960. The tide gauge is primarily intended for monitoring and forecasting sea levels during coastal flooding, while a longer time range of data and analyses of influential parameters provide insights into the effects of climate change.
In the observation period, the annual mean sea level ranged from between 211–232 cm. The greatest deviation from the mean sea level value of 218 cm in the multi-annual period 1960–2019 was recorded in 2010, with a deviation of 16 cm.
Due to the characteristic dynamics of the Adriatic Sea and the location of the Koper mareographic station in its northern area, the rise in sea levels along the Slovenian coast is mostly a consequence of the frequency of weather changes. In the global assessment of sea level rise, however, the rise is mostly attributed to sea water expansion caused by higher temperatures of the sea and the melting of glaciers.
Extreme sea levels along the Slovenian coast are caused by dropping air pressure, strong southerly winds and, in particular, the resonance between weather impacts and long-period 23-hour oscillations of the Adriatic Sea.
In the observation period, the sea level reached or exceeded the flood point (300 cm) 533 times. The highest sea level measured was 394 cm. Coastal floods mainly occur in autumn and winter and occasionally during the spring months. They occur up to 31 times a year, with an average of slightly more than eight times a year. Under unfavourable weather conditions, the number of cases in which sea level exceeds 300 cm is frequently increased due to long-term sea oscillation that can continue to occur in the form of damped oscillation for several days after the beginning of a weather disturbance.
Rising sea levels, as a result of climate change, require numerous adaptations. The urbanised Slovenian coast is partly adapted to the current flood situation and the predicted sea level rises.
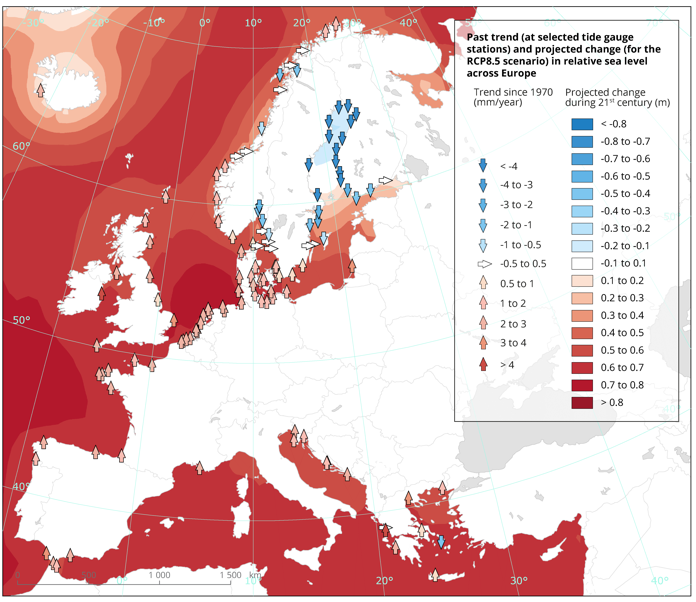
Depending on various climate change scenarios and regional differences, the sea level worldwide, as well as European seas, will rise by 20–80 cm by 2100 (EEA, 2016). Regional differences are difficult to predict, as sea level rise depends on seawater density and salinity, ocean currents, local changes in the Earth's gravitational field, vertical movements of land and atmospheric storms. According to the RCP 4.5 scenario, the sea level in the Mediterranean will rise by 40–50 cm and the level of the Adriatic Sea will rise by 30–40 cm.
By 2100, the frequency of coastal flooding will increase by a factor of 10 in most locations in Europe and up to a factor of 100 or even 1000 in some locations. The greatest change in the frequency of flooding is expected on the Atlantic coast of Spain and Portugal and the smallest on the Baltic Sea coast, as relative sea level is expected to drop there. On the Adriatic coasts, the frequency of flooding is expected to increase by a factor of 26–50. In general, a 10 cm rise in sea level increases flooding frequency by a factor of 10.


