[VD05] Nitrates in groundwater

Key message

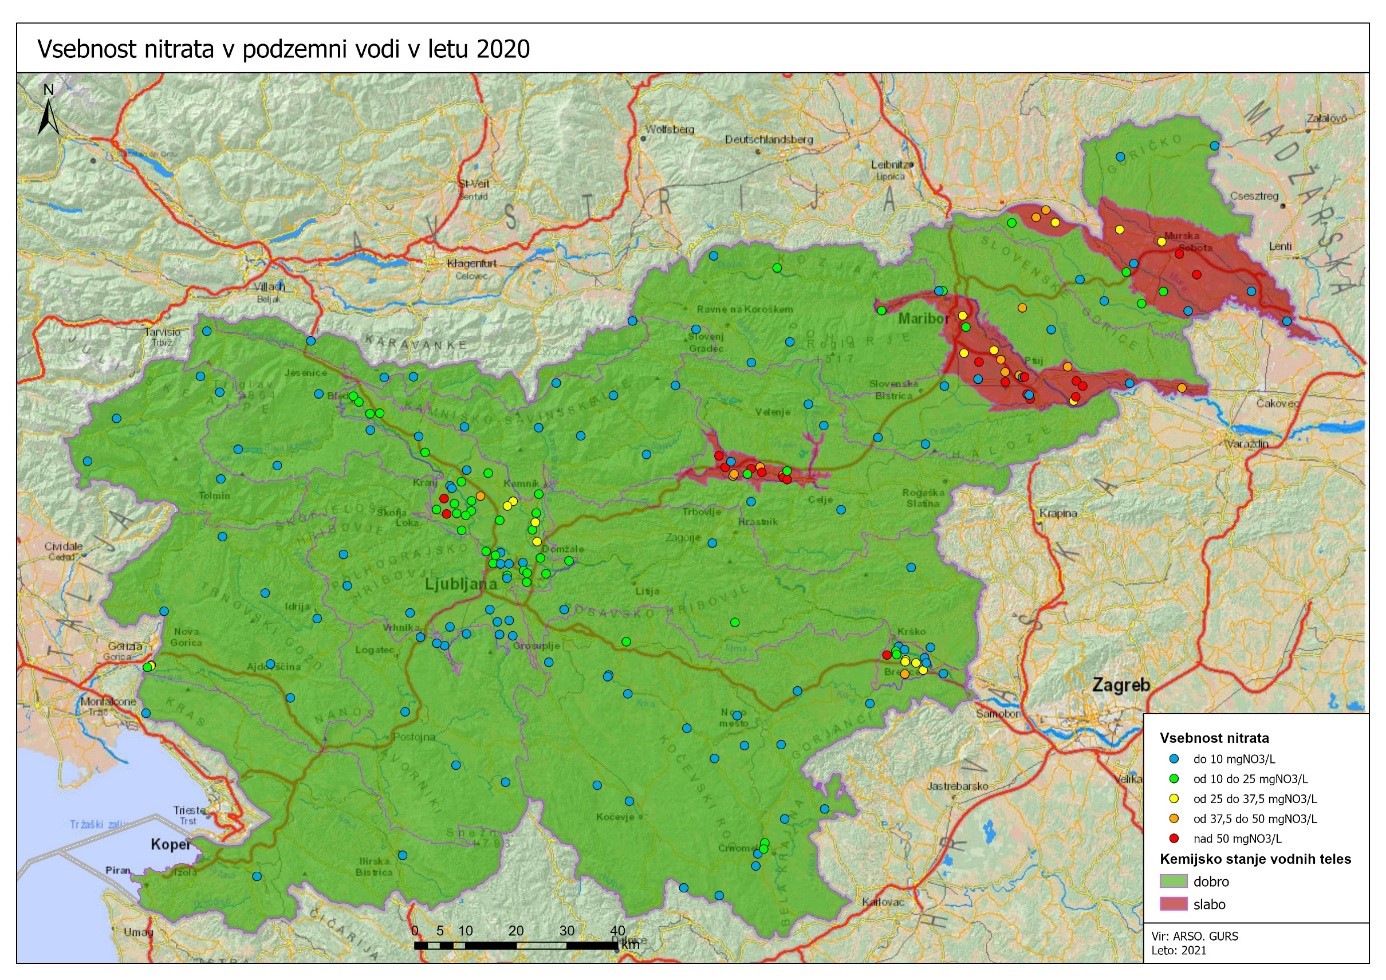
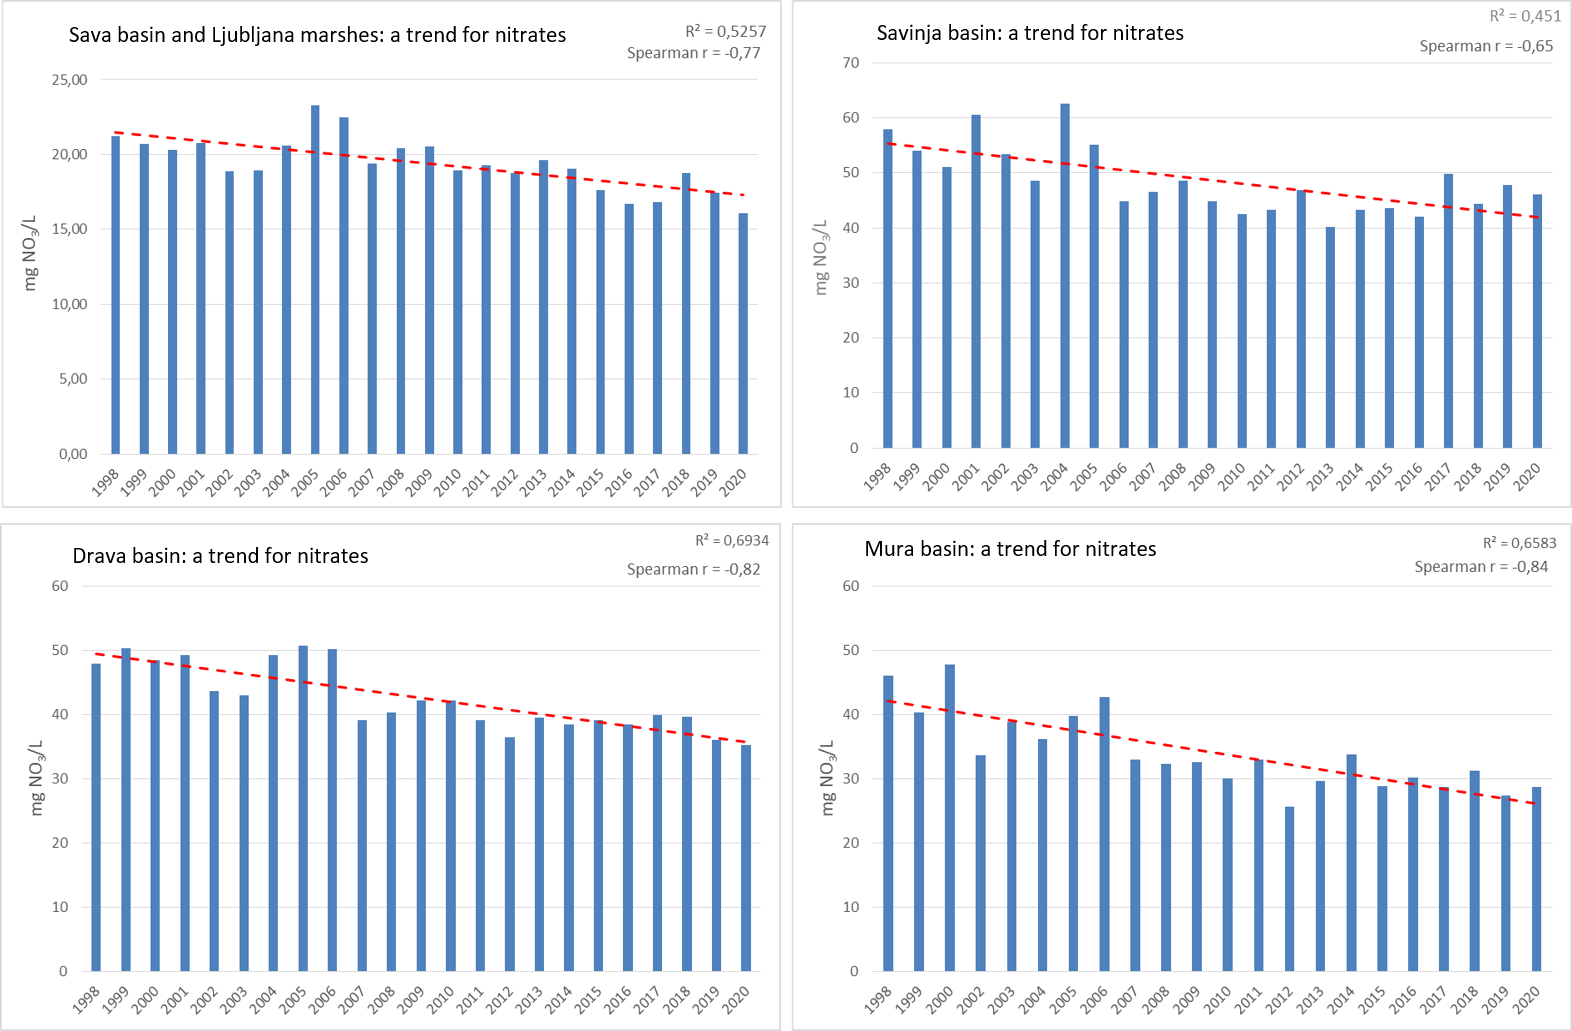
Slovenian groundwater bodies most polluted with nitrates are those with intergranular (alluvium) aquifers, particularly in north-eastern Slovenia. Groundwater in karst and fractured aquifers is less burdened with nitrates due to geographical conditions, low population density and less agricultural land. In the period 1998–2020, the average annual levels of nitrates in water bodies in the Sava valley, Ljubljansko barje, Savinja, Drava and Mura basins show a statistically significant downward trend. In other water bodies, nitrate levels are not statistically significant.
Definition
This indicator shows:
- Average annual values of nitrate in groundwater samples in Europe and Slovenia and at the sampling points of the Slovenian national monitoring in 2020.
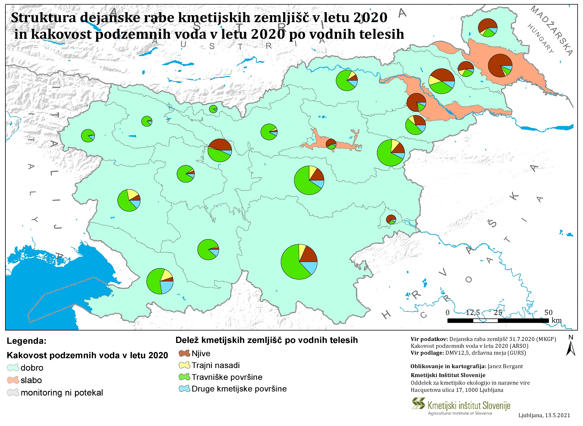
- Structure of agricultural land use and groundwater quality in the analzyed year.
-
Share of agricultural area in the surface of ground water bodies in Slovenia in the analyzed year.
-
Total annual nitrogen emissions from municipal wastewater treatment plants.
Charts
ARSO, GURS 2021 (January, 2021)
Standardised Database for Water Quality Monitoring, Slovenian Environment Agency; Waterbase European Environment Agency, 2021 (January, 2021)
| Slovenija - alluvial aquifers[mg/l] | Slovenia - karst-fractured aquifers[mg/l] | Slovenia - average[mg/l] | Europa - average[mg/l] | |
|---|---|---|---|---|
| 2004 | 40.56 | 7.48 | 15.36 | 20.04 |
| 2005 | 40.29 | 7.39 | 15.23 | 19.72 |
| 2006 | 38.59 | 7.41 | 14.84 | 19.50 |
| 2007 | 31.75 | 7.33 | 13.15 | 19.27 |
| 2008 | 32.77 | 6.78 | 12.97 | 19.20 |
| 2009 | 32.87 | 6.58 | 12.84 | 19.12 |
| 2010 | 31.95 | 5.50 | 11.80 | 19.28 |
| 2011 | 31.20 | 6.60 | 12.50 | 19.28 |
| 2012 | 30.20 | 5.36 | 11.28 | 19.28 |
| 2013 | 32.30 | 5.27 | 11.70 | 19.28 |
| 2014 | 32.21 | 5.27 | 11.69 | 19.28 |
| 2015 | 31.05 | 5.78 | 11.80 | 19.28 |
| 2016 | 25.35 | 5.50 | 11.44 | 19.28 |
| 2017 | 31.73 | 5.90 | 12.05 | 19.28 |
| 2018 | 31.95 | 5.61 | 11.88 | 19.28 |
| 2019 | 30.11 | 5.78 | 11.57 | 19.28 |
| 2020 | 29.22 | 6.24 | 11.71 | 19 |
Standardised Database for Water Quality Monitoring, Slovenian Environment Agency, 2021 (January, 2021)
| 1001 Savska kotlina in Ljubljansko barje[mg/l] | 1002 Savinjska kotlina[mg/l] | 1003 Krška kotlina[mg/l] | 3012 Dravska kotlina[mg/l] | 4016 Murska kotlina[mg/l] | quality standard[mg/l] | |
|---|---|---|---|---|---|---|
| 1998 | 23.39 | 50.01 | 21.84 | 45.10 | 47.63 | 50 |
| 1999 | 22.80 | 43.78 | 23.80 | 48.37 | 39.75 | 50 |
| 2000 | 21.64 | 47.21 | 20.39 | 45.44 | 47.34 | 50 |
| 2001 | 21.94 | 55.49 | 25.68 | 46.46 | 50 | |
| 2002 | 20.68 | 43.88 | 32.96 | 39.70 | 34.43 | 50 |
| 2003 | 20.70 | 50.45 | 22.34 | 40.29 | 39.86 | 50 |
| 2004 | 20.90 | 65.03 | 29.44 | 49.45 | 37.98 | 50 |
| 2005 | 22.90 | 57.83 | 24.76 | 54.01 | 41.99 | 50 |
| 2006 | 22.70 | 45.37 | 26.94 | 53.25 | 44.67 | 50 |
| 2007 | 18.38 | 47.29 | 21.10 | 39.12 | 32.88 | 50 |
| 2008 | 19.57 | 48.65 | 23.16 | 40.28 | 32.20 | 50 |
| 2009 | 20.63 | 44.83 | 24.19 | 42.13 | 32.57 | 50 |
| 2010 | 19.21 | 42.52 | 24.05 | 42.18 | 31.78 | 50 |
| 2011 | 19.20 | 43.20 | 21.60 | 39 | 32.90 | 50 |
| 2012 | 18.23 | 46.91 | 23.66 | 35.56 | 26.65 | 50 |
| 2013 | 18.93 | 40.24 | 28.67 | 42.31 | 31.36 | 50 |
| 2014 | 18.80 | 43.98 | 24.52 | 40.00 | 33.73 | 50 |
| 2015 | 17.96 | 44.66 | 23.64 | 40.27 | 28.73 | 50 |
| 2016 | 16.75 | 42.02 | 24.53 | 38.51 | 30.32 | 50 |
| 2017 | 16.83 | 49.85 | 24.13 | 39.09 | 28.75 | 50 |
| 2018 | 18.78 | 44.41 | 25.71 | 39.66 | 31.19 | 50 |
| 2019 | 17.46 | 47.75 | 21.85 | 36.11 | 27.37 | 50 |
| 2020 | 16.06 | 46.08 | 19.91 | 35.30 | 28.74 | 50 |
Standardised Database for Water Quality Monitoring, Slovenian Environment Agency, 2021 (January, 2021)
Environmental Agency of the Republic of Slovenia, 2020. Agricultural Institute of Slovenia (2020)
Ministry of Agriculture, Forestry and Food (2020)
Red coloured bars denote ground water bodies with poor chemical state because the nitrate concentration limit is exceeded.
| Julijske Alpe v porečju Save [%] | Karavanke [%] | Julijske Alpe v porečju Soče [%] | Kamniško-Savinjske Alpe [%] | Kraška Ljubljanica [%] | Goriška [%] | Vzhodne Alpe [%] | Cerkljansko, Škofjeloško in Polhograjsko hribovje [%] | Dolenjski kras [%] | Obala in Kras z Brkini [%] | Posavsko hribovje do osrednje Sotle [%] | Spodnji del Savinje do Sotle [%] | Haloze in Dravinjske gorice [%] | Goričko [%] | Savska kotlina in Ljubljansko Barje [%] | Vzhodne Slovenske gorice [%] | Dravska kotlina [%] | Zahodne Slovenske gorice [%] | Murska kotlina [%] | Savinjska kotlina [%] | Krška kotlina [%] | |
|---|---|---|---|---|---|---|---|---|---|---|---|---|---|---|---|---|---|---|---|---|---|
| 2020 | 10.38 | 11.29 | 15.50 | 17.74 | 24.78 | 25.43 | 25.88 | 26.00 | 27.91 | 31.57 | 35.23 | 38.41 | 48.12 | 52.05 | 52.29 | 58.94 | 59.89 | 63.28 | 68.68 | 68.82 | 69.27 |
Waste Water Treatment Plants Database, Environmental Agency of the Republic of Slovenia (2020)
| Indirect outflow into groundwater [t/year] | Outflow into surface waters [t/year] | |
|---|---|---|
| 2010 | 5.90 | 1993.30 |
| 2011 | 6.60 | 2011.40 |
| 2012 | 3.40 | 1710.40 |
| 2013 | 2.40 | 1707.10 |
| 2014 | 4.50 | 1634 |
| 2015 | 5.90 | 1502 |
| 2016 | 9.70 | 1321.40 |
| 2017 | 9.90 | 1315.50 |
| 2018 | 12 | 1388.60 |
| 2019 | 12.80 | 1283.10 |
Goals
- To improve the state of the water environment,
- to reduce emissions from dispersed sources (intensive agriculture, dispersed settlement without wastewater treatment),
- to achieve a favourable state of groundwater,
- to reduce concentrations of nitrates in overburdened groundwater below 50 mg NO3/l and to reverse the trends of increasing nitrate concentrations.


