[PP09] Precipitation

Key message

Trends in annual precipitation are not as obvious as temperature trends. Changes between years and differences between regions are significant. According to climate change projections, annual precipitation will slightly increase while changes in seasonal precipitation will be noticeable. The most worrying are summer conditions, because less precipitation and higher temperature might result in higher frequency of droughts. In winter, more precipitation may lead to an increase in flooding events.
Charts
ARSO Meteorological Data Archive, Slovenian Environment Agency, 2023
| Kredarica[mm] | Rateče[mm] | Murska Sobota[mm] | Novo mesto[mm] | Ljubljana[mm] | |
|---|---|---|---|---|---|
| 1961 | 2345.30 | 1531.60 | 785.80 | 1024.80 | 785.80 |
| 1962 | 2114.10 | 1767.60 | 931.10 | 1260.90 | 931.10 |
| 1963 | 2800.30 | 1870.40 | 831.70 | 1229 | 831.70 |
| 1964 | 2014.90 | 1553.30 | 876.30 | 1370.60 | 876.30 |
| 1965 | 2862.10 | 2373.50 | 1066.70 | 1369.70 | 1066.70 |
| 1966 | 2247.30 | 1744.50 | 969.80 | 1141.10 | 969.80 |
| 1967 | 2139.70 | 1569.90 | 784.30 | 1040.50 | 784.30 |
| 1968 | 2301.30 | 1717.30 | 612.40 | 900.10 | 612.40 |
| 1969 | 2179.70 | 1872.50 | 786.90 | 1203.90 | 786.90 |
| 1970 | 1973 | 1743.60 | 760.90 | 1183.70 | 760.90 |
| 1971 | 1435.90 | 1318.60 | 563.20 | 872.20 | 563.20 |
| 1972 | 1972.40 | 1753 | 1033.10 | 1416.20 | 1033.10 |
| 1973 | 2412.70 | 1730.30 | 808.90 | 854.90 | 808.90 |
| 1974 | 2030.30 | 1408 | 911.80 | 1275.40 | 911.80 |
| 1975 | 2317.90 | 1700.70 | 804.90 | 1046.60 | 804.90 |
| 1976 | 1974.50 | 1534.10 | 750.90 | 1059.90 | 750.90 |
| 1977 | 1971 | 1549.10 | 718.20 | 1131.70 | 718.20 |
| 1978 | 2428.60 | 1798.90 | 676.10 | 967 | 676.10 |
| 1979 | 2566.20 | 1961 | 912.40 | 1276.30 | 912.40 |
| 1980 | 2011.40 | 1697 | 862 | 1273.50 | 862 |
| 1981 | 1523.20 | 1359 | 767.50 | 1224.20 | 767.50 |
| 1982 | 2227.80 | 1588.30 | 864.20 | 1205.20 | 864.20 |
| 1983 | 1573.80 | 1243.30 | 634.30 | 963.60 | 634.30 |
| 1984 | 2353.20 | 1661.50 | 740.60 | 1322.40 | 740.60 |
| 1985 | 1795.40 | 1697.60 | 883.40 | 1283.40 | 883.40 |
| 1986 | 1991.70 | 1323.10 | 787.60 | 1121.20 | 787.60 |
| 1987 | 2682.50 | 1837 | 981.60 | 1143.10 | 981.60 |
| 1988 | 2161.50 | 1323 | 721.90 | 1030.90 | 721.90 |
| 1989 | 1820.70 | 1464 | 775.70 | 1135.10 | 775.70 |
| 1990 | 2438.60 | 1724.40 | 900.40 | 1101.50 | 900.40 |
| 1991 | 2057.90 | 1599.30 | 803.60 | 1053.60 | 803.60 |
| 1992 | 2066.40 | 1646.30 | 688.90 | 1167.50 | 688.90 |
| 1993 | 1801.50 | 1605.50 | 687.40 | 1098.30 | 687.40 |
| 1994 | 1769.40 | 1472.70 | 989.20 | 1119.50 | 989.20 |
| 1995 | 1679.70 | 1253.30 | 924 | 1298.90 | 924 |
| 1996 | 1951.40 | 1772.90 | 1025.70 | 1151.60 | 1025.70 |
| 1997 | 1800.30 | 1327.90 | 691.70 | 990.70 | 691.70 |
| 1998 | 2156.90 | 1555.50 | 839.10 | 1041 | 839.10 |
| 1999 | 2376.10 | 1578.90 | 772.40 | 1299.40 | 772.40 |
| 2000 | 2572.70 | 1891.10 | 650.60 | 826.70 | 650.60 |
| 2001 | 2229.60 | 1439.50 | 643 | 1053.40 | 643 |
| 2002 | 2093.10 | 1457.90 | 754.10 | 1379.20 | 754.10 |
| 2003 | 1623.20 | 1652.50 | 514.70 | 886.40 | 514.70 |
| 2004 | 2240.80 | 1637.50 | 803.60 | 1196.50 | 803.60 |
| 2005 | 1751.80 | 1239.20 | 868.80 | 1381.60 | 868.80 |
| 2006 | 1887 | 1175.40 | 852 | 1084.10 | 852 |
| 2007 | 1761.40 | 1310.50 | 816.80 | 1113.50 | 816.80 |
| 2008 | 2179.70 | 1910.50 | 708.10 | 1134.50 | 708.10 |
| 2009 | 2259.10 | 1781.50 | 989 | 1066.10 | 989 |
| 2010 | 2342.70 | 1703.40 | 876.20 | 1278.40 | 876.20 |
| 2011 | 1497.10 | 1292.60 | 692.80 | 834.40 | 692.80 |
| 2012 | 2203.90 | 1700.40 | 781.60 | 1146.60 | 781.60 |
| 2013 | 2176.20 | 1598.30 | 912 | 1259.30 | 912 |
| 2014 | 2449.10 | 2084.10 | 1093 | 1482.40 | 1093 |
| 2015 | 1755.10 | 1232.80 | 690.40 | 1084.20 | 690.40 |
| 2016 | 2289.90 | 1665.70 | 787.30 | 1146.20 | 787.30 |
| 2017 | 2229.50 | 1965.50 | 930.30 | 1119.50 | 930.30 |
| 2018 | 1740 | 1503.80 | 824.70 | 1164.80 | 824.70 |
| 2019 | 2440.10 | 1869 | 896.30 | 1214.20 | 896.30 |
| 2020 | 2375.50 | 1838.70 | 849.40 | 1048.70 | 849.40 |
| 2021 | 1939.20 | 1500.80 | 824.90 | 1022.20 | 824.90 |
| 2022 | 1719 | 1157.70 | 704 | 1141.90 | 704 |
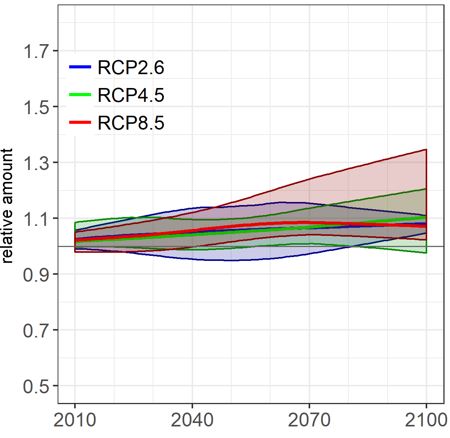
Assessment of climate changes in Slovenia by the end of the 21st century, 2018
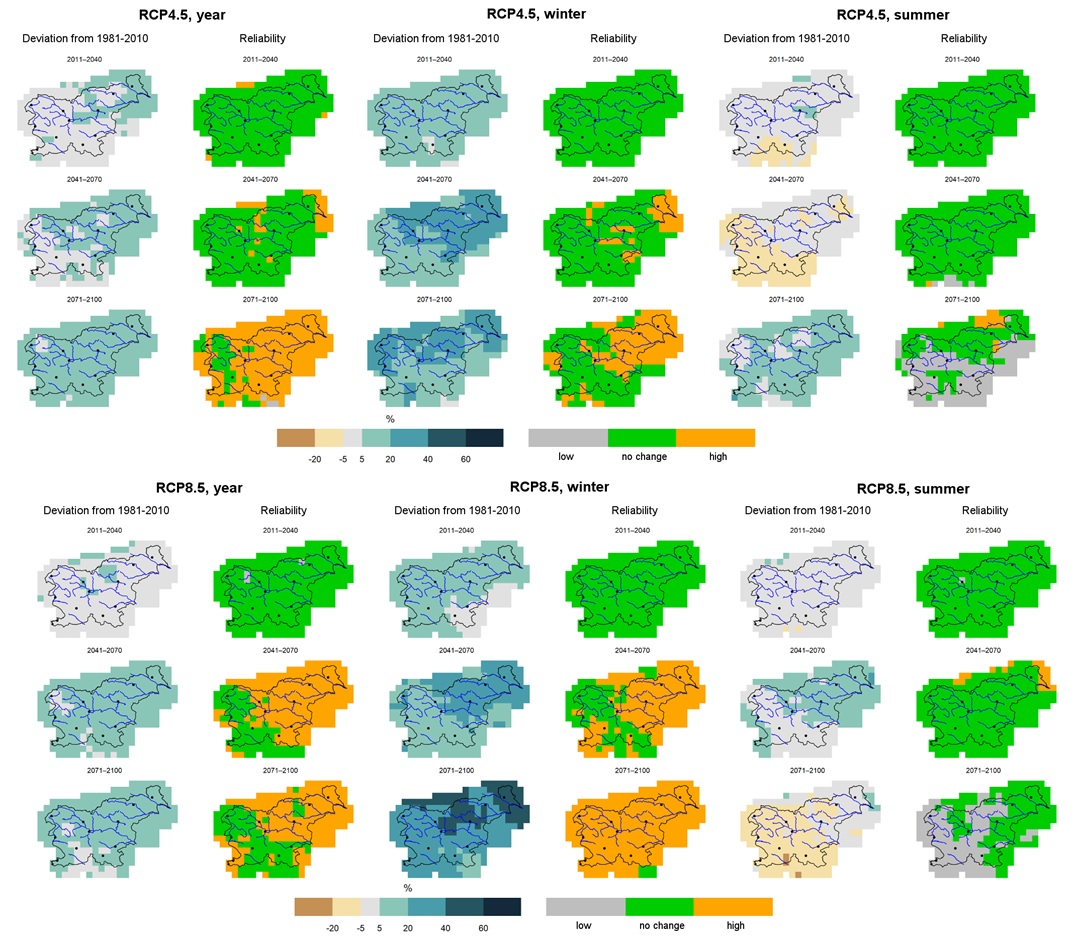
Assessment of climate changes in Slovenia by the end of the 21st century, 2018
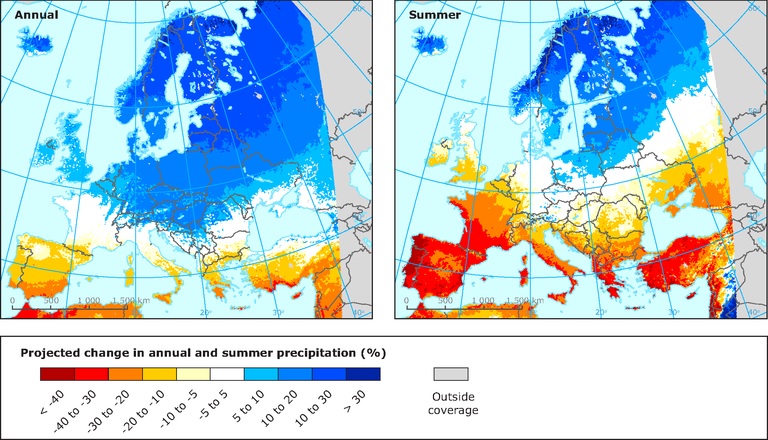
EEA, Pojected change in annual and summer precipitation, 2019
Projected changes in annual (left) and summer (right) precipitation (%) in the period 2071-2100 compared to the baseline period 1971-2000 for the forcing scenario RCP 8.5. Model simulations are based on the multi-model ensemble average of RCM simulations from the EURO-CORDEX initiative.
Methodology
- Agencija RS za okolje, Naše okolje, mesečni bilten ARSO.
- Evropska agencija za okolje, 2019. Projected change in annual and summer precipitation.
- Svetovna meteorološka organizacija, 2013. The global climate 2001-2010, Decade of climate extremes
- Zakon o državni meteorološki, hidrološki, oceanografski in seizmološki službi, (Uradni list RS, št. 60/17)
- Agencija RS za okolje, 2018. Ocena podnebnih sprememb v Sloveniji do konca 21. stoletja. Ljubljana, november 2018.


