[SE03] Human Development Index

Key message

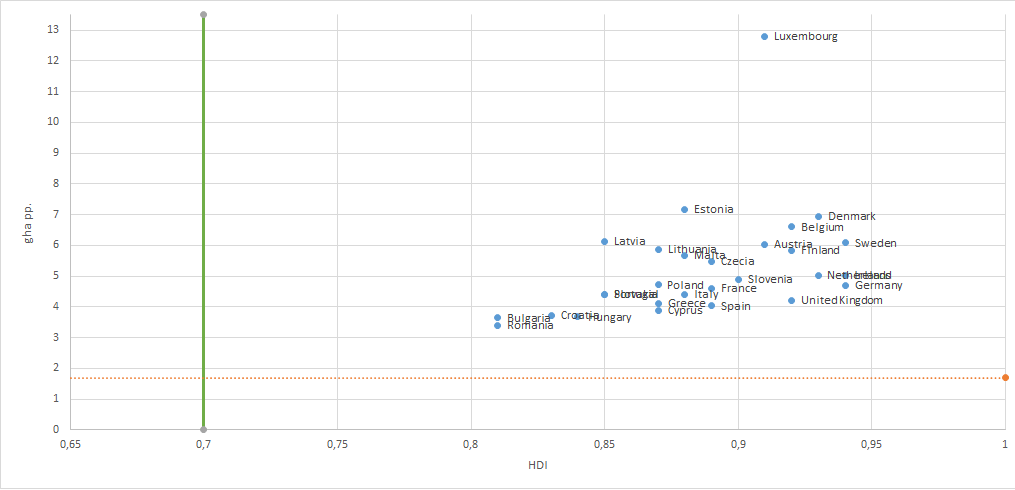
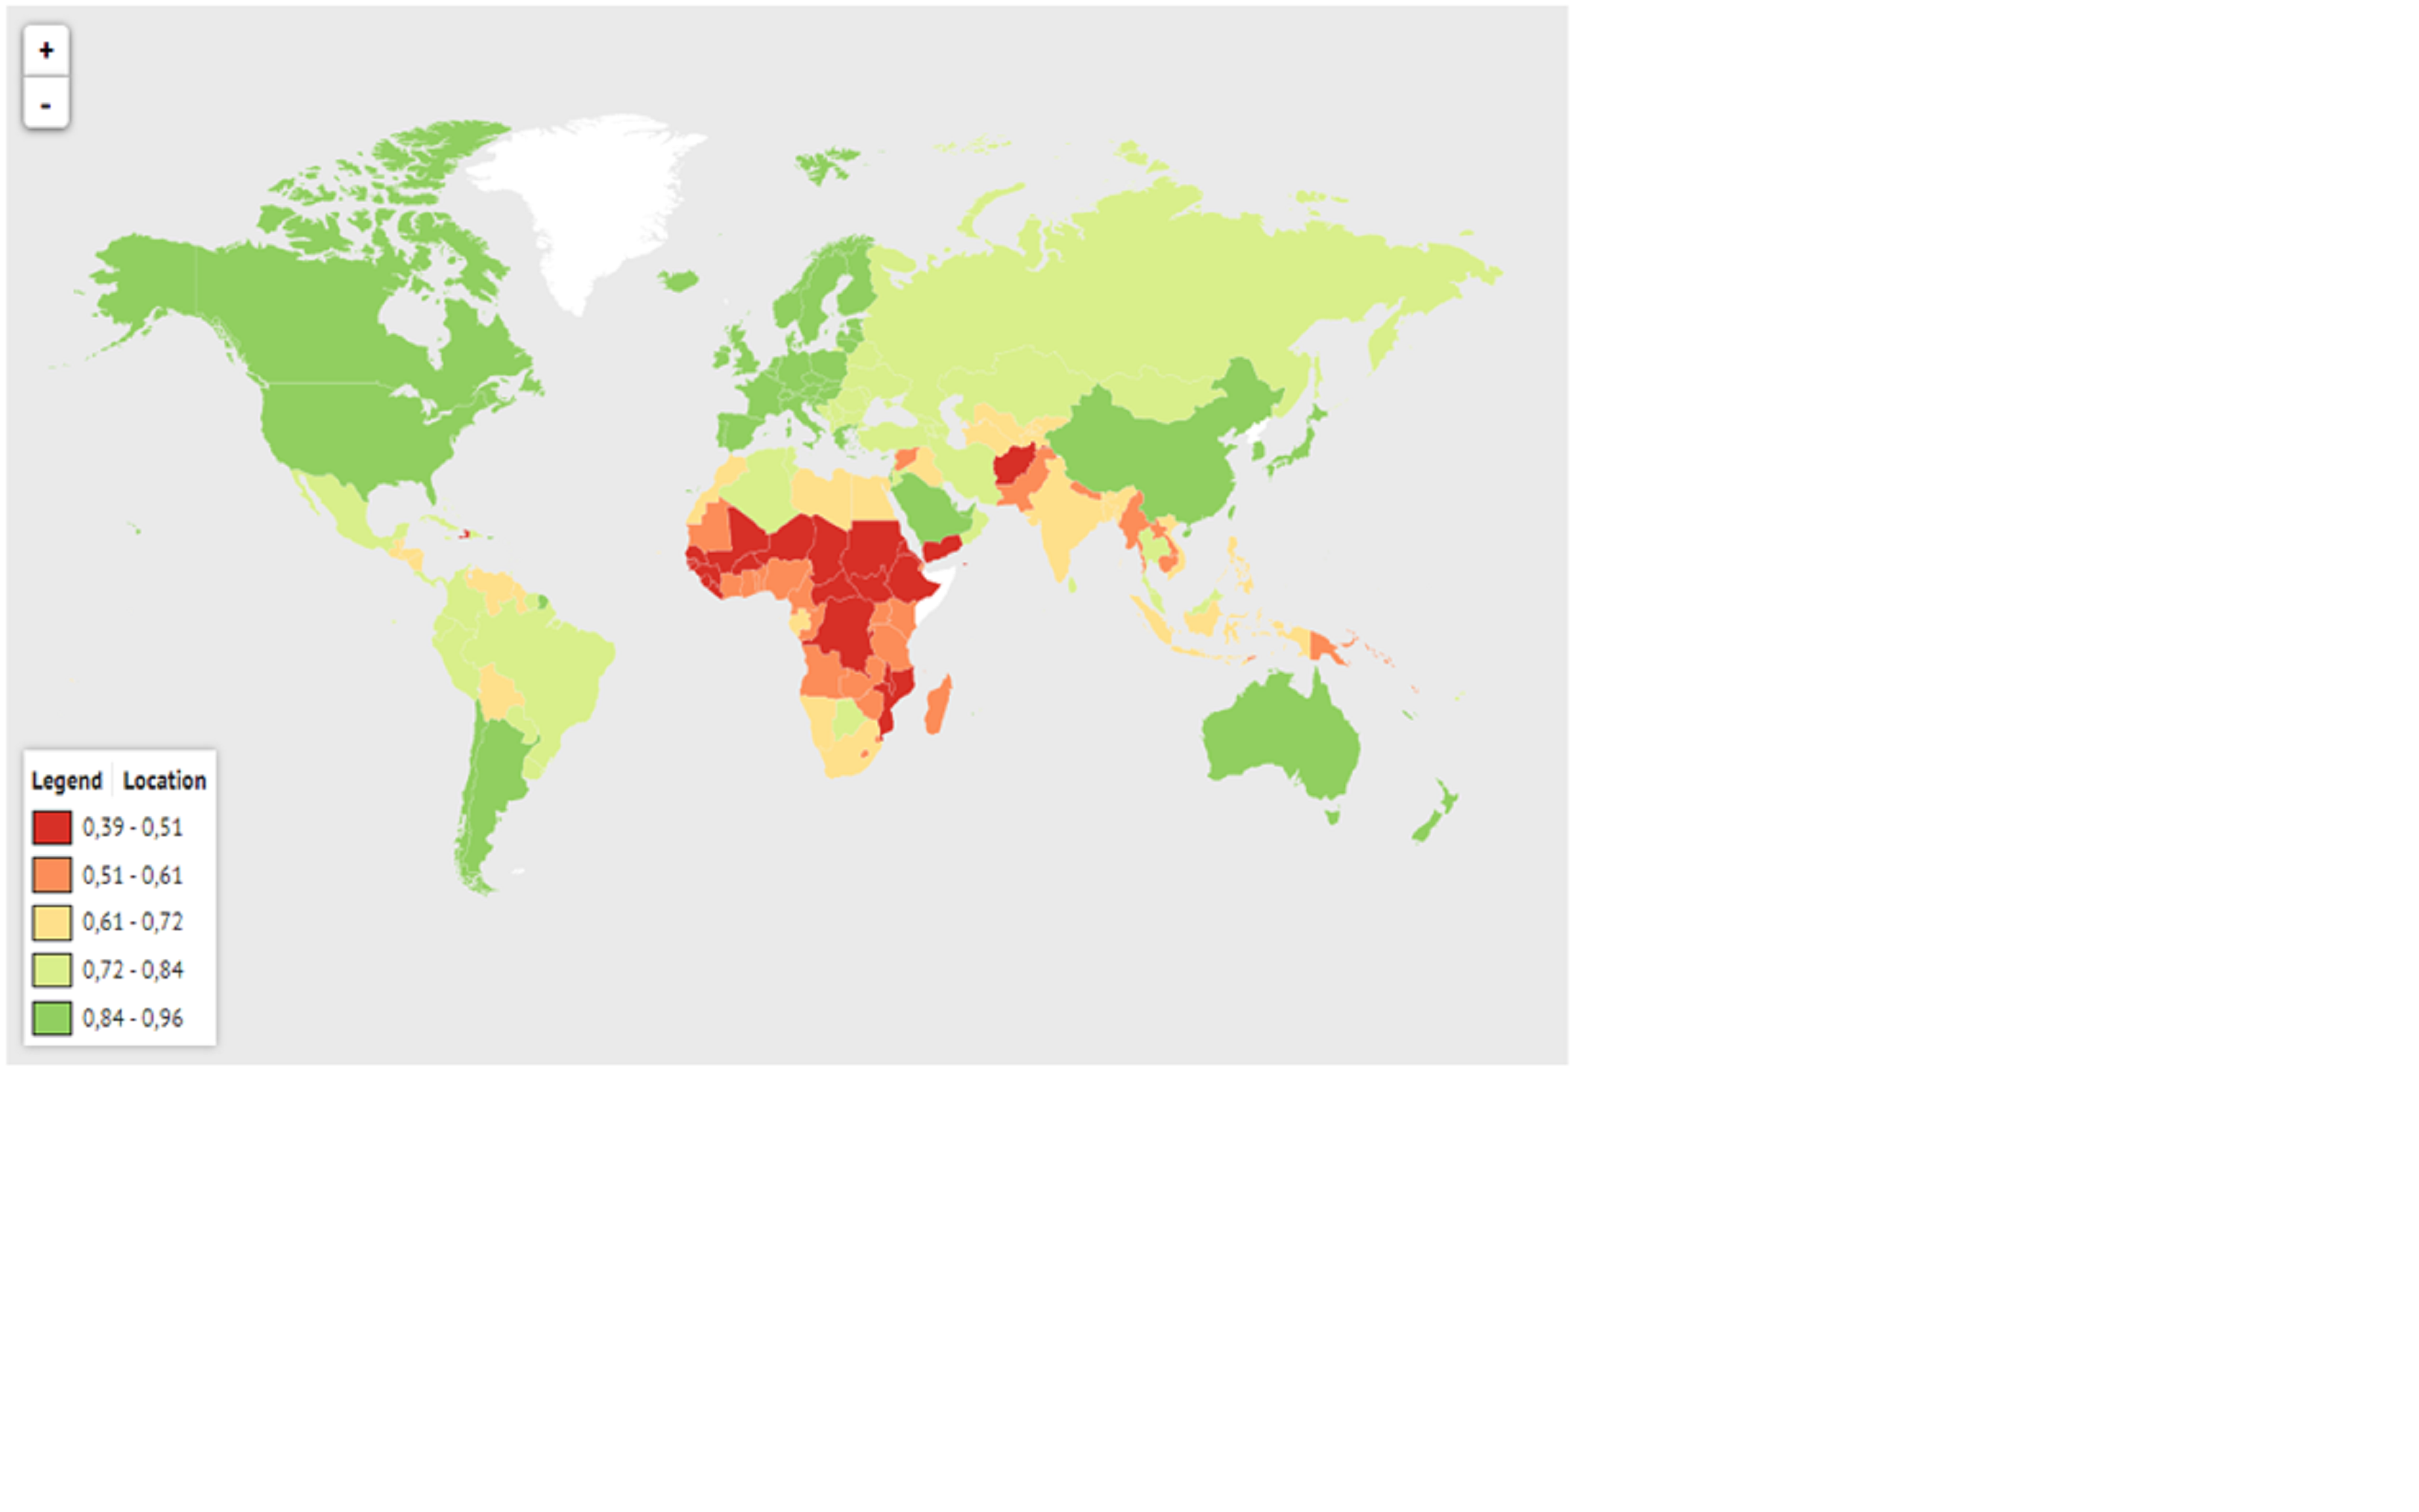
The indicator monitors the economic, social and environmental dimensions of sustainable development by comparing the HDI - the human development index and the ecological footprint. Between 1990 and 2019, the value of the Human Development Index (HDI) increased from 0.774 to 0.917 (by 18.5%). Slovenia is ranked among the countries with a very high human development index, in 22nd place out of 189 countries included in the calculations. In general, the higher the HDI of a country is, the higher the ecological footprint is. Current situation shows that countries with higher ecological footprint will have to change behavioural habits of their inhabitants in order to live sustainably and within the limits of our planet.
Charts
UNDP 2020, Human Development Report 2020 (9. 06. 2021)
| Human development index[index] | Life expectancy index[index] | GDP index[index] | Education index[index] | Life expectancy index[dollars] | Life expectancy index[years] | Education index[years] | |
|---|---|---|---|---|---|---|---|
| 1990 | 0.77 | 0.82 | 0.82 | 0.70 | 22042 | 73.20 | 11.45 |
| 1995 | 0.79 | 0.84 | 0.81 | 0.72 | 21590 | 74.50 | 11.90 |
| 2000 | 0.83 | 0.86 | 0.84 | 0.80 | 26249 | 75.90 | 13.15 |
| 2005 | 0.87 | 0.89 | 0.87 | 0.85 | 30972 | 77.60 | 14.20 |
| 2010 | 0.89 | 0.91 | 0.88 | 0.88 | 33058 | 79.40 | 14.60 |
| 2015 | 0.89 | 0.93 | 0.88 | 0.87 | 32904 | 80.70 | 14.55 |
| 2016 | 0.90 | 0.94 | 0.88 | 0.88 | 34093 | 80.90 | 14.70 |
| 2017 | 0.91 | 0.94 | 0.89 | 0.89 | 35988 | 81 | 14.85 |
| 2018 | 0.91 | 0.94 | 0.89 | 0.90 | 37423 | 81.20 | 14.95 |
| 2019 | 0.92 | 0.94 | 0.90 | 0.91 | 38080 | 81.30 | 15.15 |
UNDP 2020, Human Development Report 2020 (9. 06. 2021)
| Human Development Index (HDI) [index] | Inequality adjusted HDI [index] | planetary pressures adjusted HDI [index] | |
|---|---|---|---|
| Czech Republic | 0.90 | 0.86 | 0.77 |
| Slovenia | 0.92 | 0.88 | 0.80 |
| Finland | 0.94 | 0.89 | 0.77 |
| Slovakia | 0.86 | 0.81 | 0.72 |
| Denmark | 0.94 | 0.88 | 0.82 |
| Hungary | 0.85 | 0.79 | 0.78 |
| Sweden | 0.95 | 0.88 | 0.82 |
| Estonia | 0.89 | 0.83 | 0.71 |
| Austria | 0.92 | 0.86 | 0.77 |
| Netherlands | 0.94 | 0.88 | 0.79 |
| Poland | 0.88 | 0.81 | 0.75 |
| Croatia | 0.85 | 0.78 | 0.78 |
| Ireland | 0.96 | 0.89 | 0.83 |
| Malta | 0.90 | 0.82 | 0.79 |
| Belgium | 0.93 | 0.86 | 0.80 |
| United Kingdom | 0.93 | 0.86 | 0.83 |
| Germany | 0.95 | 0.87 | 0.81 |
| France | 0.90 | 0.82 | 0.80 |
| Cyprus | 0.89 | 0.81 | 0.77 |
| Latvia | 0.87 | 0.78 | 0.78 |
| Luxembourg | 0.92 | 0.83 | 0.50 |
| Lithuania | 0.88 | 0.79 | 0.75 |
| Bulgaria | 0.82 | 0.72 | 0.75 |
| Greece | 0.89 | 0.79 | 0.77 |
| Romania | 0.83 | 0.73 | 0.76 |
| Portugal | 0.86 | 0.76 | 0.78 |
| Italy | 0.89 | 0.78 | 0.79 |
| Spain | 0.90 | 0.78 | 0.80 |
GFN, 2021
| Bulgaria[gha per person] | Romania[gha per person] | Croatia[gha per person] | Hungary[gha per person] | Slovakia[gha per person] | Portugal[gha per person] | Latvia[gha per person] | Poland[gha per person] | Lithuania[gha per person] | Cyprus[gha per person] | Greece[gha per person] | Estonia[gha per person] | Italy[gha per person] | Malta[gha per person] | Czecia[gha per person] | France[gha per person] | Spain[gha per person] | Slovenia[gha per person] | Luxembourg[gha per person] | Austria[gha per person] | Belgium[gha per person] | United Kingdom[gha per person] | Finland[gha per person] | Denmark[gha per person] | Netherlands[gha per person] | Sweden[gha per person] | Germany[gha per person] | Ireland[gha per person] | |
|---|---|---|---|---|---|---|---|---|---|---|---|---|---|---|---|---|---|---|---|---|---|---|---|---|---|---|---|---|
| HDI | 0.81 | 0.81 | 0.83 | 0.84 | 0.85 | 0.85 | 0.85 | 0.87 | 0.87 | 0.87 | 0.87 | 0.88 | 0.88 | 0.88 | 0.89 | 0.89 | 0.89 | 0.90 | 0.91 | 0.91 | 0.92 | 0.92 | 0.92 | 0.93 | 0.93 | 0.94 | 0.94 | 0.94 |
| Ecological Footprint | 3.64 | 3.40 | 3.72 | 3.67 | 4.41 | 4.40 | 6.13 | 4.71 | 5.86 | 3.88 | 4.12 | 7.16 | 4.41 | 5.68 | 5.47 | 4.60 | 4.03 | 4.90 | 12.79 | 6.02 | 6.60 | 4.20 | 5.84 | 6.93 | 5.02 | 6.08 | 4.70 | 5.01 |
Knoema, World data atlas, Human development index, 2021
Goals
Countries operate in accordance with the Sustainable Development Goals if their HDI is 0.7 or more and their ecological footprint is less than 1.6 gha per capita (GFN, 2021). Following this goal countries follow also the other targets such as:
• healthy and active life of the inhabitants;
• knowledge and skills for quality life and work;
• a decent life for all;
• economic stability;
• economic and technological progress in harmony with nature;
• protect the Earth from destruction, including through sustainable consumption and production, sustainable handling of natural resources.


