[VD15] Groundwater recharge

Key message

Total renewable groundwater quantity in the shallow aquifers of Slovenia in the hydrological year 2016 was below the long-term average for the 30-year period 1981–2010.
Definition
This indicator is expressed as annual groundwater recharge of shallow aquifers in a hydrological year (1 November–31 October) in all groundwater bodies for the entire territory of the Republic of Slovenia.
Groundwater is replenished by aquifer recharge, which is a complex process of water inflow into the subterranean saturated zone. Recharge is assessed by the regional water balance model and expressed as the height of water infiltrated into aquifers (mm) or the annual variability index (the 1981–2010 average = 100).
Charts
Regional water balance model GROWA-SI (Forschungszentrum JÜLICH, Slovenian Environment Agency), 2017
Regional water balance model GROWA-SI (FZ JÜLICH, Slovenian Environment Agency), 2017
| hydrological year (1 Nov - 31 Oct) | 1971 | 1972 | 1973 | 1974 | 1975 | 1976 | 1977 | 1978 | 1979 | 1980 | |
|---|---|---|---|---|---|---|---|---|---|---|---|
| annual average | mm | 229 | 385 | 269 | 321 | 309 | 310 | 308 | 312 | 385 | 348 |
| deviation (mm) | mm | -60 | 96 | -20 | 32 | 20 | 21 | 19 | 23 | 96 | 59 |
| deviation (%) | % | -21 | 33 | -7 | 11 | 7 | 7 | 7 | 8 | 33 | 21 |
| period average 1981-2010 | mm | 289 | 289 | 289 | 289 | 289 | 289 | 289 | 289 | 289 | 289 |
| hydrological year (1 Nov - 31 Oct) | 1981 | 1982 | 1983 | 1984 | 1985 | 1986 | 1987 | 1988 | 1989 | 1990 | |
| annual average | mm | 266 | 326 | 207 | 335 | 327 | 277 | 340 | 252 | 270 | 311 |
| deviation (mm) | mm | -23 | 37 | -82 | 46 | 38 | -12 | 51 | -37 | -19 | 22 |
| deviation (%) | % | -8 | 13 | -28 | 16 | 13 | -4 | 18 | -13 | -7 | 8 |
| period average 1981-2010 | mm | 289 | 289 | 289 | 289 | 289 | 289 | 289 | 289 | 289 | 289 |
| hydrological year (1 Nov - 31 Oct) | 1991 | 1992 | 1993 | 1994 | 1995 | 1996 | 1997 | 1998 | 1999 | 2000 | |
| annual average | mm | 302 | 303 | 256 | 276 | 335 | 339 | 253 | 300 | 314 | 308 |
| deviation (mm) | mm | 13 | 14 | -33 | -13 | 46 | 50 | -36 | 11 | 25 | 19 |
| deviation (%) | % | 4 | 5 | -11 | -5 | 16 | 17 | -12 | 4 | 9 | 6 |
| period average 1981-2010 | mm | 289 | 289 | 289 | 289 | 289 | 289 | 289 | 289 | 289 | 289 |
| hydrological year (1 Nov - 31 Oct) | 2001 | 2002 | 2003 | 2004 | 2005 | 2006 | 2007 | 2008 | 2009 | 2010 | |
| annual average | mm | 273 | 277 | 184 | 337 | 282 | 222 | 243 | 340 | 321 | 400 |
| deviation (mm) | mm | -16 | -12 | -105 | 48 | -7 | -67 | -46 | 51 | 32 | 111 |
| deviation (%) | % | -6 | -4 | -36 | 17 | -2 | -23 | -16 | 18 | 11 | 38 |
| period average 1981-2010 | mm | 289 | 289 | 289 | 289 | 289 | 289 | 289 | 289 | 289 | 289 |
| hydrological year (1 Nov - 31 Oct) | 2011 | 2012 | 2013 | 2014 | 2015 | 2016 | |||||
| annual average | mm | 174 | 207 | 333 | 461 | 301 | 263 | ||||
| deviation (mm) | mm | -115 | -82 | 44 | 172 | 12 | -26 | ||||
| deviation (%) | % | -40 | -28 | 15 | 60 | 4 | -9 | ||||
| period average 1981-2010 | mm | 289 | 289 | 289 | 289 | 289 | 289 |
Regionalni vodno-bilančni model GROWA-SI (FZ JÜLICH & Agencija RS za okolje), 2017
Goals
Groundwater is traditionally the major source of drinking water in Slovenia, contributing most of the required quantities in the country. Slovenian groundwater sources exhibit high regional and seasonal variability and, lately, there has been a tendency toward more frequent and more pronounced extremes. As water supply crises can be expected in the future, this indicator is gaining importance. The main benefits of the methods used in the development of this indicator, as well as the benefits of the indicator itself, are as follows:
· improvement of groundwater quantity assessment, as well as forecasting and alarming in case of hydrological extremes, e.g. hydrological drought in aquifers;
· identification of groundwater areas prone to frequent hydrological droughts;
· improvement of groundwater management in the fields of drinking water supply and conservation of groundwater-dependent aquatic ecosystems.
Comment
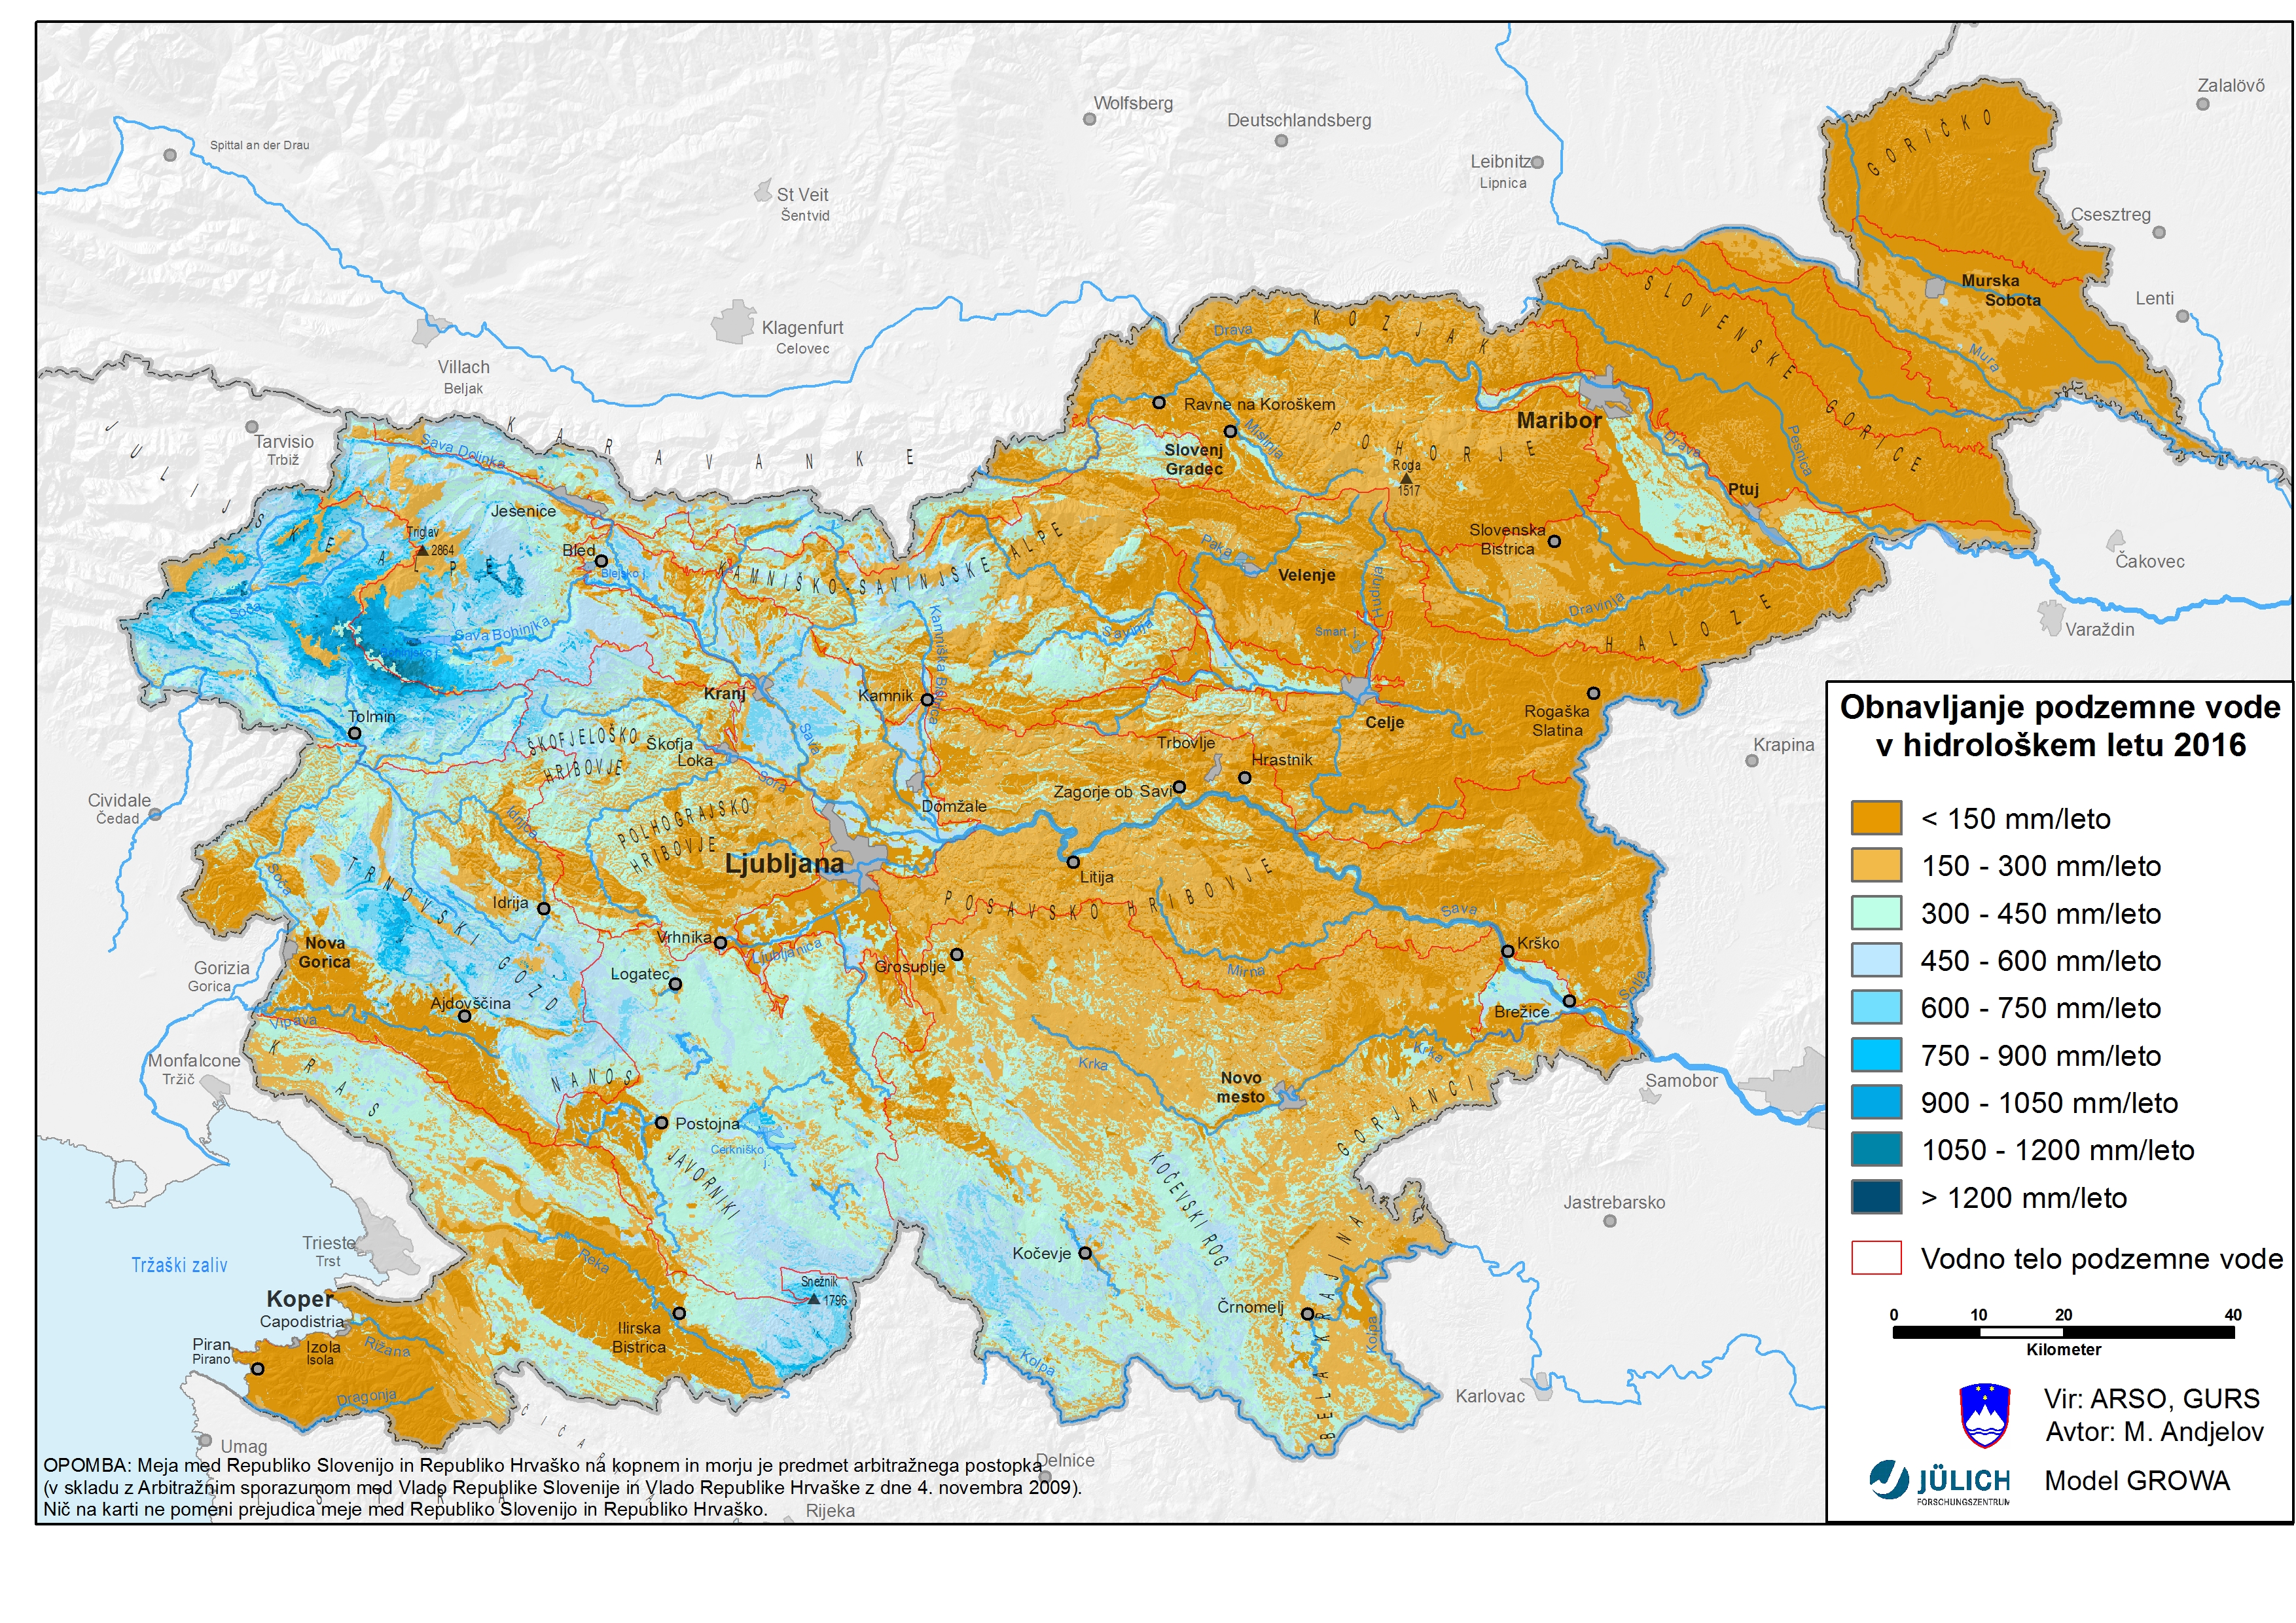
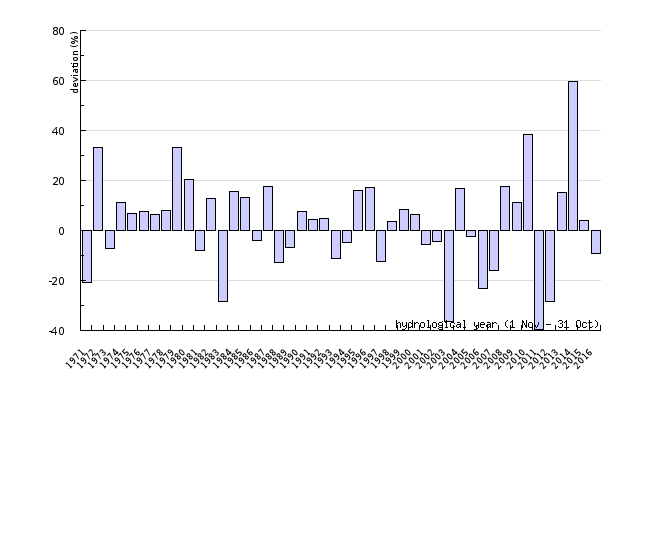
The lowest recharged quantities as well as the highest variability in year-to-year groundwater recharge in shallow aquifers were recorded in groundwater bodies of northeastern Slovenia (Figure VD15-1). In the recent decade, the average recharge of aquifers in the Goričko region was 10-times lower than that of aquifers in the Julian Alps. Apart from this highly pronounced spatial variability, great variability over the course of time was recorded in the recent decade. Compared to the average for the 1981–2010 period, the index of annual groundwater recharge shows great variability, indicating high sensitivity of shallow aquifers in terms of groundwater quantity.
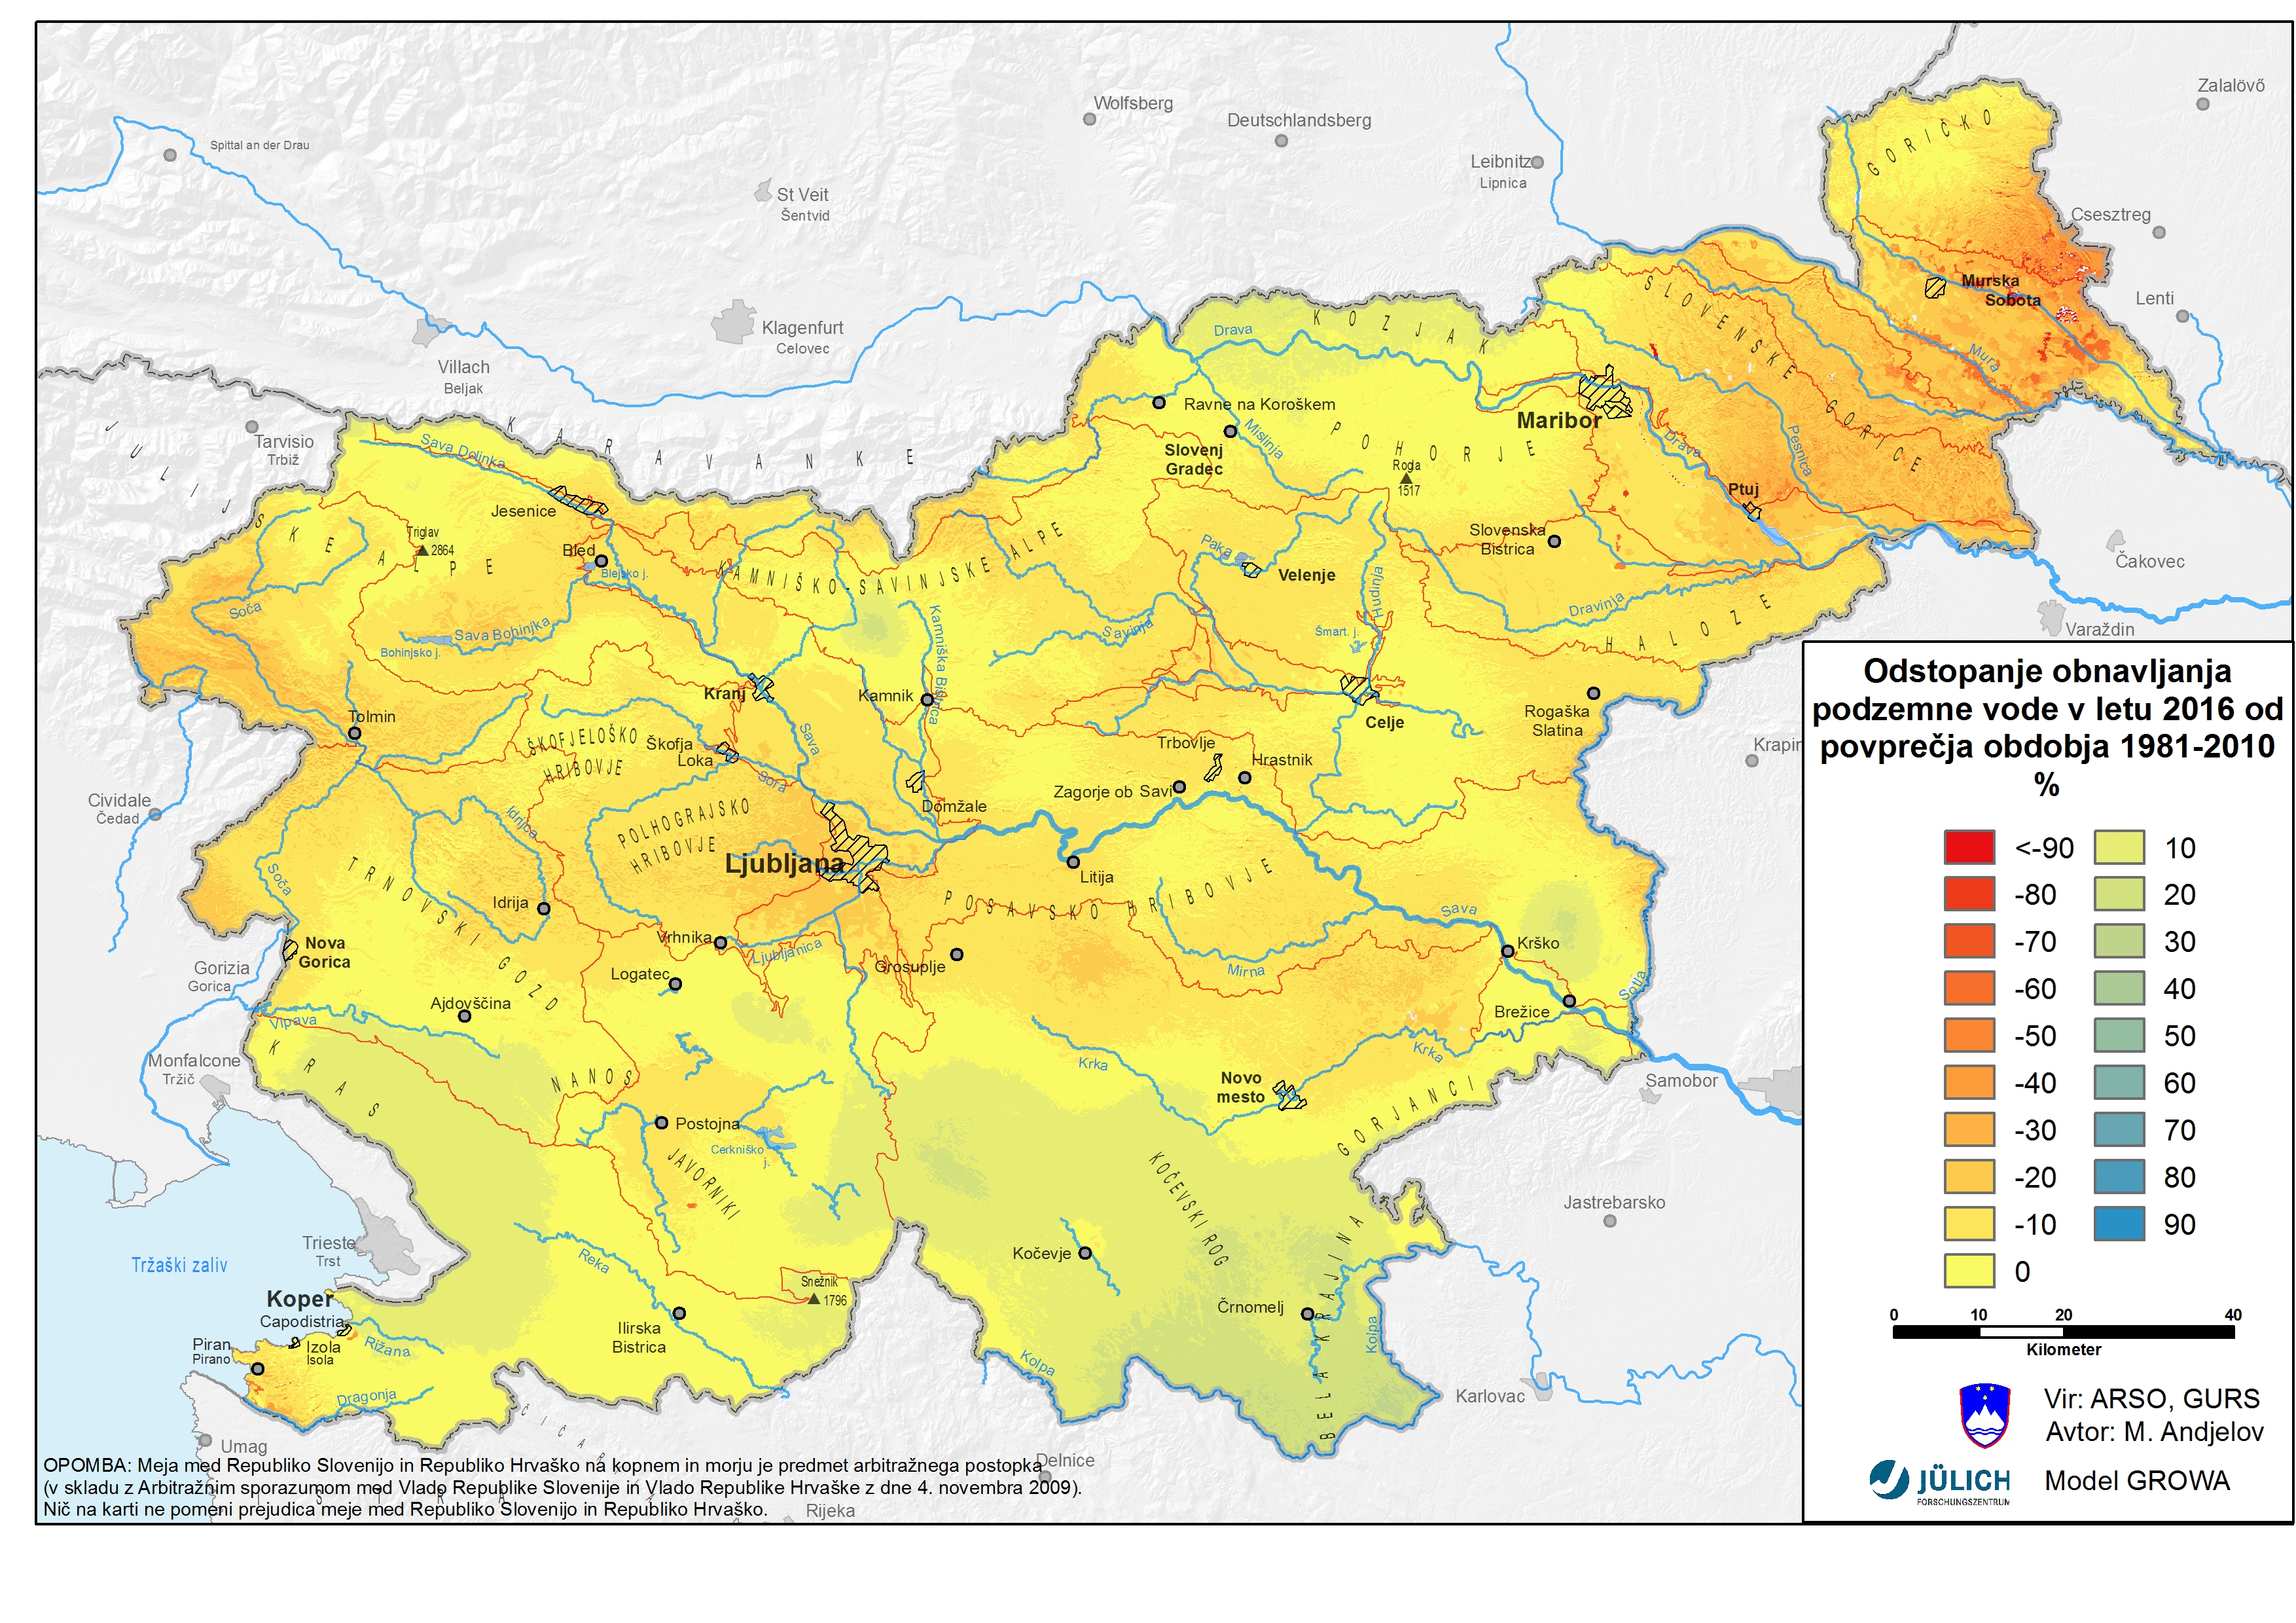
In the hydrological year of 2016, the total rechargeable groundwater quantity in shallow aquifers of Slovenia was markedly below the 1981–2010 average (Figure VD15-2). In the hydrological year of 2016, the highest deviation from the 1981–2010 average was recorded in the groundwater bodies of the Mura basin and in the eastern part of Slovenske Gorice. In other areas, almost no deviations were detected.


