-
-
-
-
-
-
-
-
Tools and collections
- Environmental atlas
- EIONET in Slovenia
- Environmental indicators
- IED devices
- Endangered species
- IS-waste

-
-
Tools and collections
- Environmental atlas
- EIONET in Slovenia
- Environmental indicators
- IED devices
- Endangered species
- IS-waste

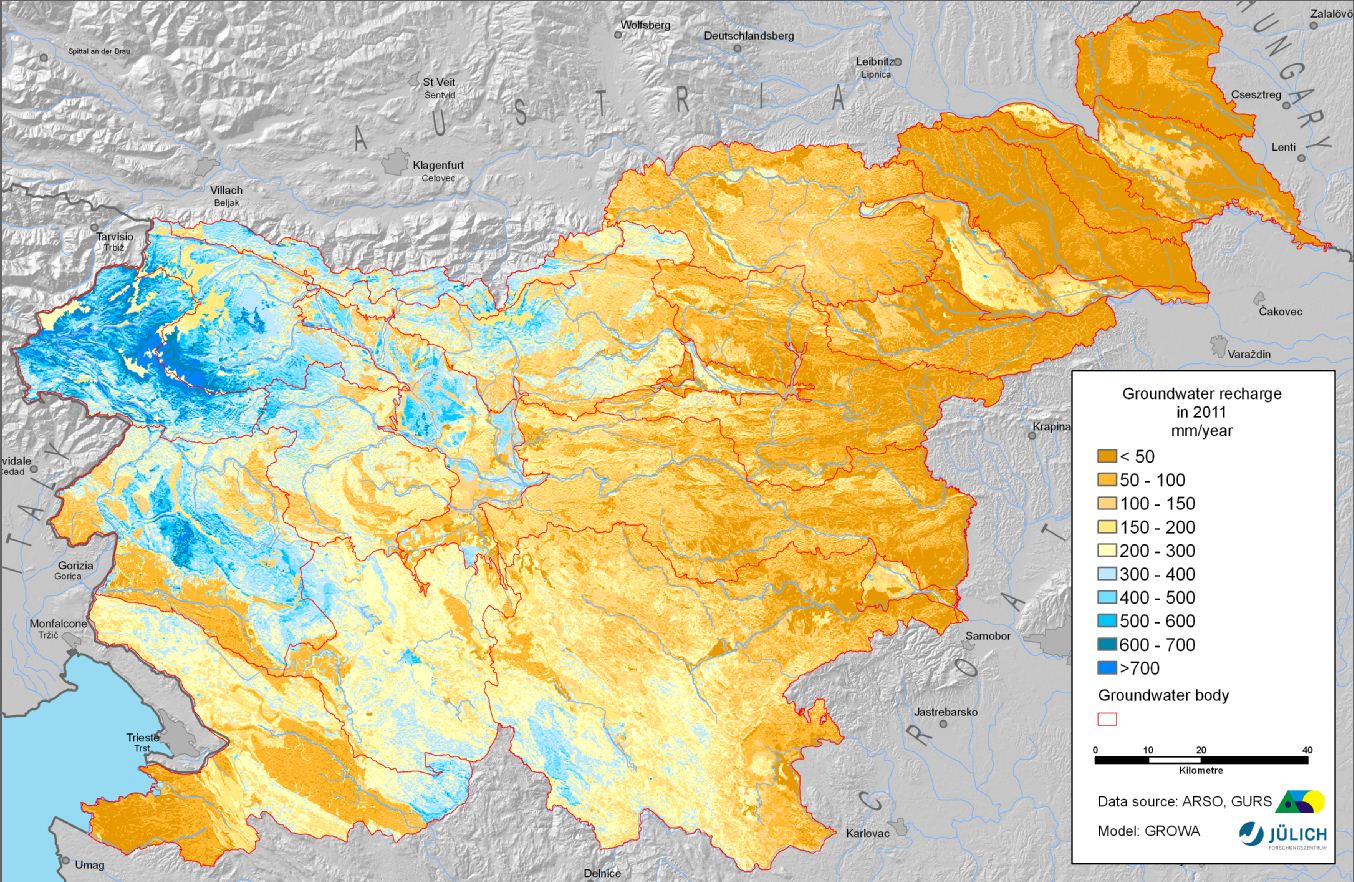
[VD15] Groundwater recharge

Key message

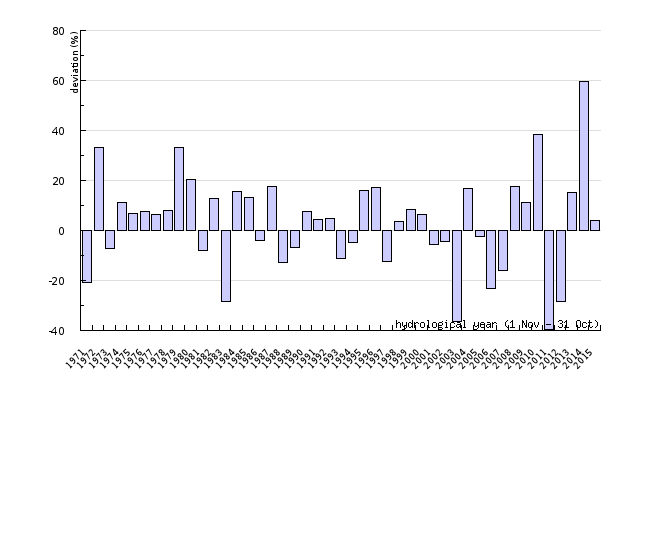
Total renewable groundwater quantity in shallow aquifers of Slovenia in hydrological year 2015 was slightly above the long term average of the 30 years period 1981-2010.
Charts
Regional water balance model GROWA-SI (Forschungszentrum JÜLICH, Slovenian Environment Agency), 2016
Regional water balance model GROWA-SI (FZ JÜLICH, Slovenian Environment Agency), 2016
| hydrological year (1 Nov - 31 Oct) | 1971 | 1972 | 1973 | 1974 | 1975 | 1976 | 1977 | 1978 | 1979 | 1980 | |
|---|---|---|---|---|---|---|---|---|---|---|---|
| annual average | mm | 229 | 385 | 269 | 321 | 309 | 310 | 308 | 312 | 385 | 348 |
| deviation (mm) | mm | -60 | 96 | -20 | 32 | 20 | 21 | 19 | 23 | 96 | 59 |
| deviation (%) | % | -21 | 33 | -7 | 11 | 7 | 7 | 7 | 8 | 33 | 21 |
| period average 1981-2010 | mm | 289 | 289 | 289 | 289 | 289 | 289 | 289 | 289 | 289 | 289 |
| hydrological year (1 Nov - 31 Oct) | 1981 | 1982 | 1983 | 1984 | 1985 | 1986 | 1987 | 1988 | 1989 | 1990 | |
| annual average | mm | 266 | 326 | 207 | 335 | 327 | 277 | 340 | 252 | 270 | 311 |
| deviation (mm) | mm | -23 | 37 | -82 | 46 | 38 | -12 | 51 | -37 | -19 | 22 |
| deviation (%) | % | -8 | 13 | -28 | 16 | 13 | -4 | 18 | -13 | -7 | 8 |
| period average 1981-2010 | mm | 289 | 289 | 289 | 289 | 289 | 289 | 289 | 289 | 289 | 289 |
| hydrological year (1 Nov - 31 Oct) | 1991 | 1992 | 1993 | 1994 | 1995 | 1996 | 1997 | 1998 | 1999 | 2000 | |
| annual average | mm | 302 | 303 | 256 | 276 | 335 | 339 | 253 | 300 | 314 | 308 |
| deviation (mm) | mm | 13 | 14 | -33 | -13 | 46 | 50 | -36 | 11 | 25 | 19 |
| deviation (%) | % | 4 | 5 | -11 | -5 | 16 | 17 | -12 | 4 | 9 | 6 |
| period average 1981-2010 | mm | 289 | 289 | 289 | 289 | 289 | 289 | 289 | 289 | 289 | 289 |
| hydrological year (1 Nov - 31 Oct) | 2001 | 2002 | 2003 | 2004 | 2005 | 2006 | 2007 | 2008 | 2009 | 2010 | |
| annual average | mm | 273 | 277 | 184 | 337 | 282 | 222 | 243 | 340 | 321 | 400 |
| deviation (mm) | mm | -16 | -12 | -105 | 48 | -7 | -67 | -46 | 51 | 32 | 111 |
| deviation (%) | % | -6 | -4 | -36 | 17 | -2 | -23 | -16 | 18 | 11 | 38 |
| period average 1981-2010 | mm | 289 | 289 | 289 | 289 | 289 | 289 | 289 | 289 | 289 | 289 |
| hydrological year (1 Nov - 31 Oct) | 2011 | 2012 | 2013 | 2014 | 2015 | ||||||
| annual average | mm | 174 | 207 | 333 | 461 | 301 | |||||
| deviation (mm) | mm | -115 | -82 | 44 | 172 | 12 | |||||
| deviation (%) | % | -40 | -28 | 15 | 60 | 4 | |||||
| period average 1981-2010 | mm | 289 | 289 | 289 | 289 | 289 |
Goals
Groundwater is traditionally the major source of drinking water in Slovenia, contributing majority of all water supply quantity in the country. Slovenian groundwater sources exhibit high regional and seasonal variability, and lately there is a tendency of more frequent and more pronounced droughts. Since there is to be expected probable future crisis in water supply, the indicator is gaining on importance. Main contributions of the method used in idicator development, as of the indicator itself, are as follows:
- to improve groundwater quantity assessment, as well as forecasting and alarming in case of hydrologic extremes, e.g. hydrologic drought in aquifers;
- to identify those aquifer areas prone to frequent hydrologic droughts;
- to improve groundwater management in the fields of drinking water supply and protection of groundwater dependent aquatic ecosystems.
Related indicators
Jože Uhan, Mišo Andjelov, Slovenian Environment Agency


