[VD15] Groundwater recharge

Key message

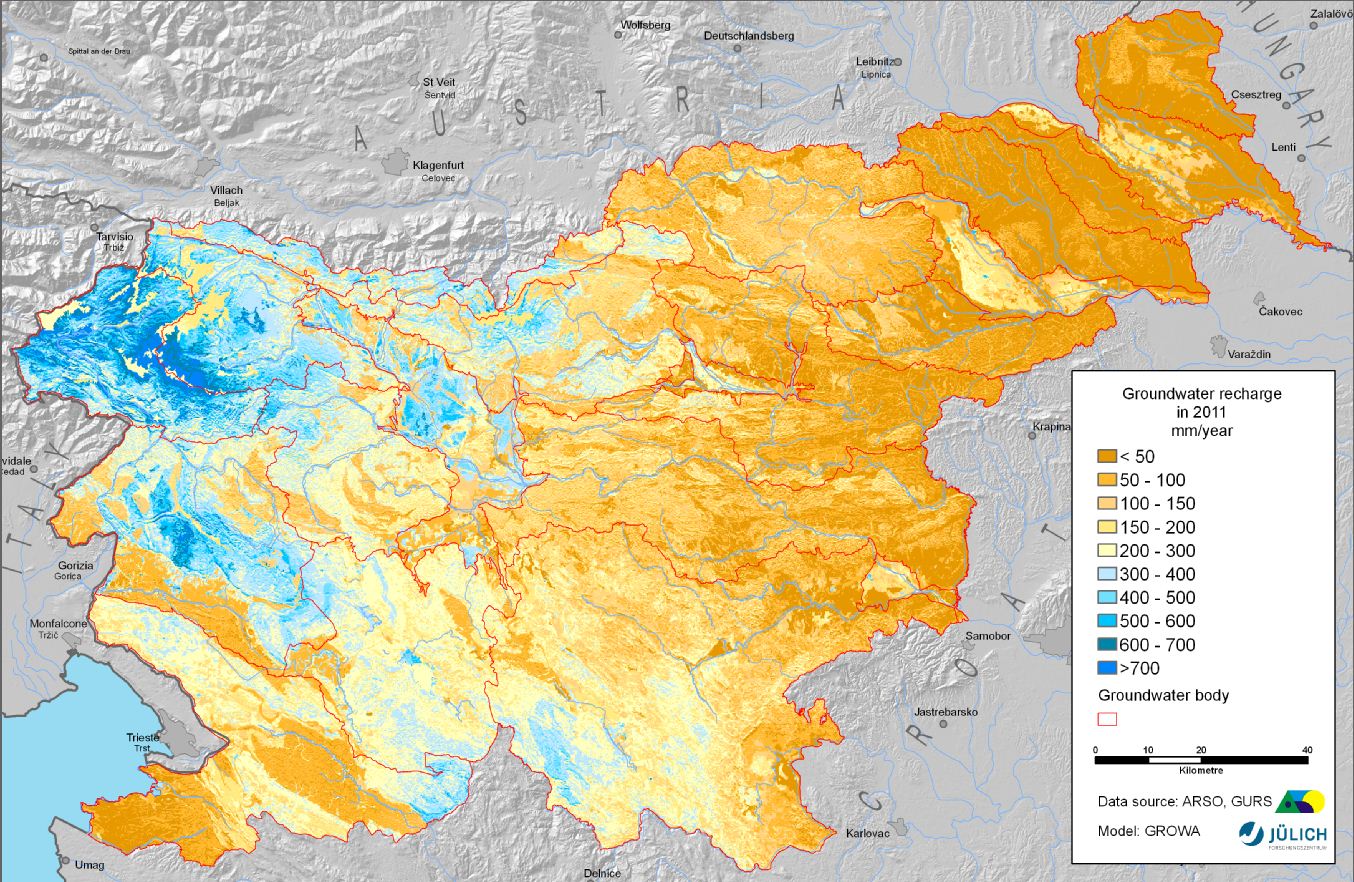
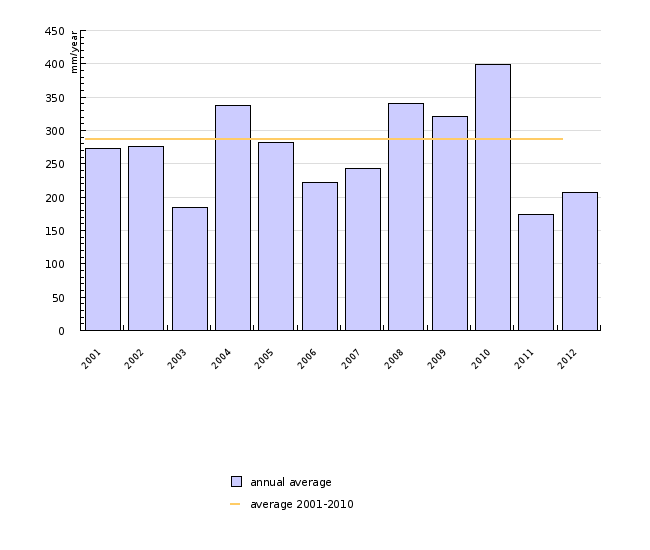
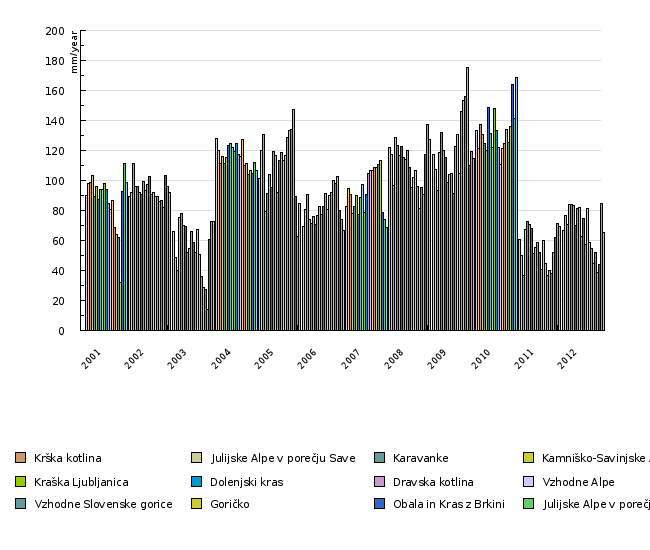
Total renewable groundwater quantity in shallow aquifers of Slovenia in 2012 was below the 2000 to 2010 average, but slightely higher than in years 2011 and 2003, the most dry year of the last decade.
Charts
Groundwater recharge modelling by water balance model GROWA-SI (Forschungszentrum JÜLICH, Slovenian Environment Agency), 2013
Groundwater recharge modelling by water balance model GROWA-SI (Forschungszentrum JÜLICH, Slovenian Environment Agency), 2013
| 2001 | 2002 | 2003 | 2004 | 2005 | 2006 | 2007 | 2008 | 2009 | 2010 | ||
|---|---|---|---|---|---|---|---|---|---|---|---|
| annual average | mm/leto | 273 | 277 | 184 | 337 | 282 | 222 | 243 | 340 | 321 | 400 |
| average 2001-2010 | mm/leto | 288 | 288 | 288 | 288 | 288 | 288 | 288 | 288 | 288 | 288 |
| 2011 | 2012 | ||||||||||
| annual average | mm/leto | 174 | 206 | ||||||||
| average 2001-2010 | mm/leto | 288 | 288 |
Groundwater recharge modelling by water balance model GROWA-SI (Forschungszentrum JÜLICH, Slovenian Environment Agency), 2013
| 2001 | 2002 | 2003 | 2004 | 2005 | 2006 | 2007 | 2008 | 2009 | 2010 | ||
|---|---|---|---|---|---|---|---|---|---|---|---|
| Savska kotlina in Ljubljansko Barje | mm/leto | 90 | 89 | 66 | 128 | 102 | 70 | 82 | 122 | 117 | 134 |
| Savinjska kotlina | mm/leto | 98 | 92 | 49 | 120 | 120 | 81 | 95 | 117 | 108 | 121 |
| Krška kotlina | mm/leto | 98 | 111 | 40 | 111 | 131 | 91 | 91 | 97 | 93 | 137 |
| Julijske Alpe v porečju Save | mm/leto | 103 | 96 | 75 | 116 | 79 | 74 | 78 | 129 | 119 | 131 |
| Karavanke | mm/leto | 89 | 96 | 78 | 111 | 91 | 72 | 83 | 123 | 132 | 125 |
| Kamniško-Savinjske Alpe | mm/leto | 96 | 92 | 70 | 115 | 104 | 76 | 90 | 116 | 120 | 120 |
| Cerkljansko, Škofjeloško in Polhograjsko hribovje | mm/leto | 87 | 91 | 69 | 123 | 96 | 71 | 77 | 123 | 115 | 148 |
| Posavsko hribovje do osrednje Sotle | mm/leto | 94 | 99 | 52 | 124 | 119 | 77 | 89 | 115 | 99 | 132 |
| Spodnji del Savinje do Sotle | mm/leto | 94 | 93 | 55 | 122 | 117 | 83 | 97 | 114 | 104 | 122 |
| Kraška Ljubljanica | mm/leto | 98 | 97 | 66 | 119 | 92 | 77 | 78 | 120 | 104 | 148 |
| Dolenjski kras | mm/leto | 94 | 103 | 58 | 125 | 113 | 83 | 90 | 109 | 91 | 134 |
| Dravska kotlina | mm/leto | 85 | 90 | 52 | 117 | 119 | 91 | 105 | 96 | 123 | 122 |
| Vzhodne Alpe | mm/leto | 80 | 92 | 67 | 116 | 113 | 81 | 107 | 102 | 131 | 111 |
| Haloze in Dravinjske gorice | mm/leto | 86 | 90 | 51 | 127 | 116 | 90 | 107 | 107 | 104 | 122 |
| Zahodne Slovenske gorice | mm/leto | 69 | 89 | 36 | 110 | 128 | 92 | 109 | 96 | 146 | 125 |
| Murska kotlina | mm/leto | 64 | 86 | 28 | 112 | 134 | 100 | 109 | 81 | 153 | 134 |
| Vzhodne Slovenske gorice | mm/leto | 62 | 87 | 27 | 104 | 134 | 98 | 111 | 95 | 156 | 126 |
| Goričko | mm/leto | 32 | 82 | 14 | 106 | 147 | 102 | 113 | 91 | 175 | 136 |
| Obala in Kras z Brkini | mm/leto | 93 | 103 | 61 | 105 | 89 | 80 | 78 | 117 | 110 | 164 |
| Julijske Alpe v porečju Soče | mm/leto | 112 | 96 | 72 | 112 | 63 | 74 | 74 | 137 | 119 | 141 |
| Goriška brda in Trnovsko-Banjška planota | mm/leto | 99 | 92 | 73 | 107 | 85 | 67 | 69 | 127 | 115 | 168 |
| 2011 | 2012 | ||||||||||
| Savska kotlina in Ljubljansko Barje | mm/leto | 61 | 67 | ||||||||
| Savinjska kotlina | mm/leto | 50 | 77 | ||||||||
| Krška kotlina | mm/leto | 36 | 70 | ||||||||
| Julijske Alpe v porečju Save | mm/leto | 67 | 84 | ||||||||
| Karavanke | mm/leto | 72 | 84 | ||||||||
| Kamniško-Savinjske Alpe | mm/leto | 71 | 84 | ||||||||
| Cerkljansko, Škofjeloško in Polhograjsko hribovje | mm/leto | 68 | 70 | ||||||||
| Posavsko hribovje do osrednje Sotle | mm/leto | 52 | 81 | ||||||||
| Spodnji del Savinje do Sotle | mm/leto | 55 | 82 | ||||||||
| Kraška Ljubljanica | mm/leto | 59 | 63 | ||||||||
| Dolenjski kras | mm/leto | 52 | 75 | ||||||||
| Dravska kotlina | mm/leto | 40 | 57 | ||||||||
| Vzhodne Alpe | mm/leto | 60 | 81 | ||||||||
| Haloze in Dravinjske gorice | mm/leto | 45 | 59 | ||||||||
| Zahodne Slovenske gorice | mm/leto | 37 | 55 | ||||||||
| Murska kotlina | mm/leto | 40 | 45 | ||||||||
| Vzhodne Slovenske gorice | mm/leto | 38 | 52 | ||||||||
| Goričko | mm/leto | 52 | 38 | ||||||||
| Obala in Kras z Brkini | mm/leto | 62 | 44 | ||||||||
| Julijske Alpe v porečju Soče | mm/leto | 71 | 85 | ||||||||
| Goriška brda in Trnovsko-Banjška planota | mm/leto | 69 | 65 |
Goals
Groundwater is traditionally the major source of drinking water in Slovenia, contributing about 97% of all water supply quantity in the country. Slovenian groundwater sources exhibit high regional and seasonal variability, and lately there is a tendency of more frequent and more pronounced droughts. Since there is to be expected probable future crisis in water supply, the indicator is gaining on importance. Main contributions of the method used in idicator development, as of the indicator itself, are as follows:
- to improve groundwater quantity assessment, as well as forecasting and alarming in case of hydrologic extremes, e.g. hydrologic drought in aquifers;
- to identify those aquifer areas prone to frequent hydrologic droughts;
- to improve groundwater management in the fields of drinking water supply and protection of groundwater dependent aquatic ecosystems.


